| __timestamp | Allegion plc | Trane Technologies plc |
|---|---|---|
| Wednesday, January 1, 2014 | 2118300000 | 12891400000 |
| Thursday, January 1, 2015 | 2068100000 | 13300700000 |
| Friday, January 1, 2016 | 2238000000 | 13508900000 |
| Sunday, January 1, 2017 | 2408200000 | 14197600000 |
| Monday, January 1, 2018 | 2731700000 | 15668200000 |
| Tuesday, January 1, 2019 | 2854000000 | 16598900000 |
| Wednesday, January 1, 2020 | 2719900000 | 12454700000 |
| Friday, January 1, 2021 | 2867400000 | 14136400000 |
| Saturday, January 1, 2022 | 3271900000 | 15991700000 |
| Sunday, January 1, 2023 | 3650800000 | 17677600000 |
| Monday, January 1, 2024 | 3772200000 | 19838200000 |
Unveiling the hidden dimensions of data
In the competitive landscape of industrial technology, Trane Technologies plc and Allegion plc have showcased distinct revenue trajectories over the past decade. From 2014 to 2023, Trane Technologies has consistently outperformed Allegion, with revenues peaking at approximately $17.7 billion in 2023, marking a 37% increase from 2014. Allegion, while smaller in scale, has demonstrated robust growth, with revenues rising by 72% over the same period, reaching around $3.7 billion in 2023.
Trane Technologies experienced a slight dip in 2020, likely due to global economic disruptions, but quickly rebounded, achieving a 42% growth from 2020 to 2023. Allegion, on the other hand, maintained a steady upward trajectory, reflecting its resilience and strategic market positioning. These trends highlight the dynamic nature of the industrial sector and the importance of adaptability in sustaining growth.
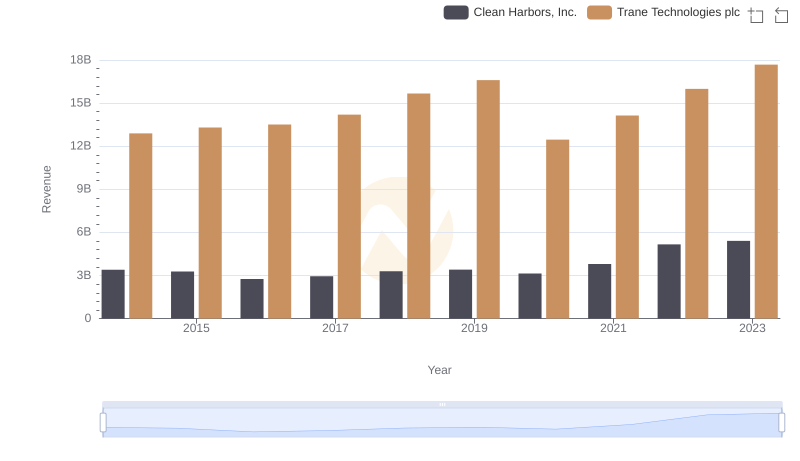
Breaking Down Revenue Trends: Trane Technologies plc vs Clean Harbors, Inc.
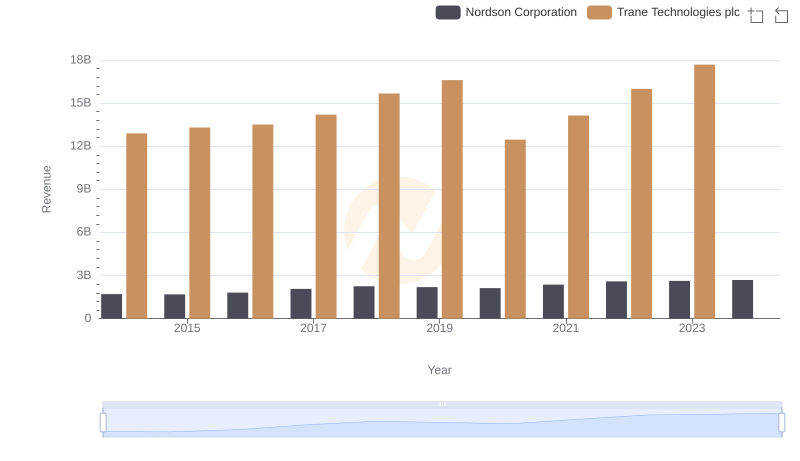
Trane Technologies plc vs Nordson Corporation: Examining Key Revenue Metrics
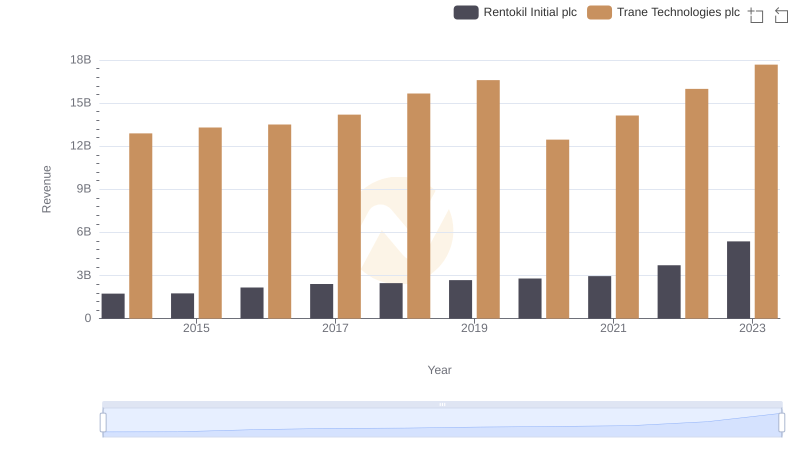
Revenue Showdown: Trane Technologies plc vs Rentokil Initial plc
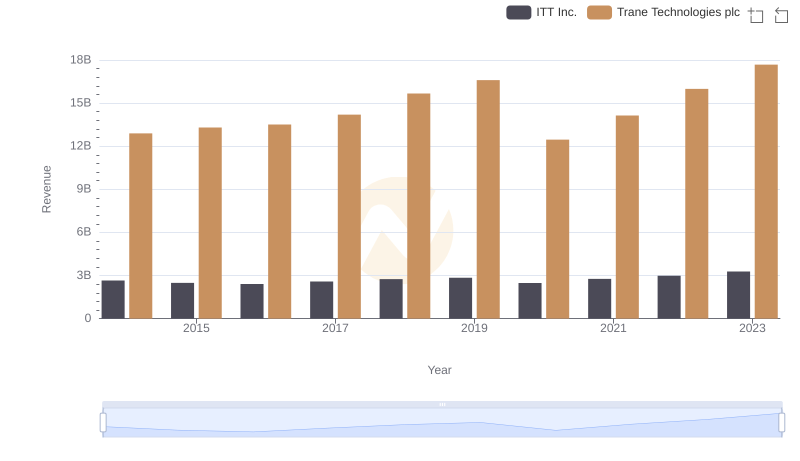
Comparing Revenue Performance: Trane Technologies plc or ITT Inc.?

Trane Technologies plc vs TFI International Inc.: Examining Key Revenue Metrics
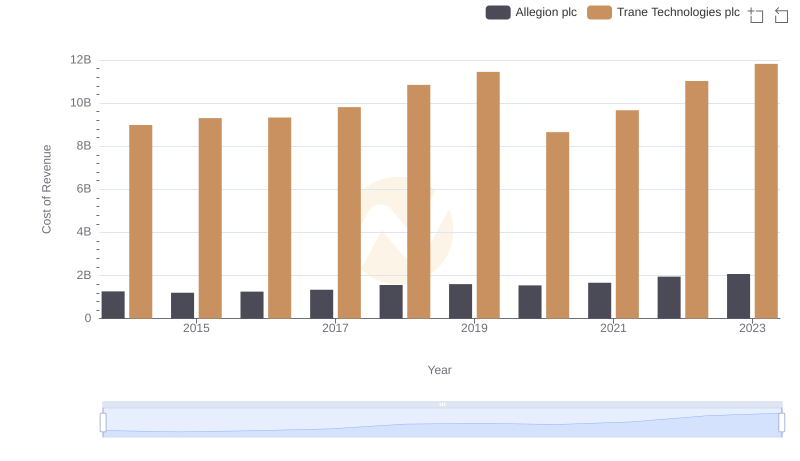
Cost of Revenue: Key Insights for Trane Technologies plc and Allegion plc
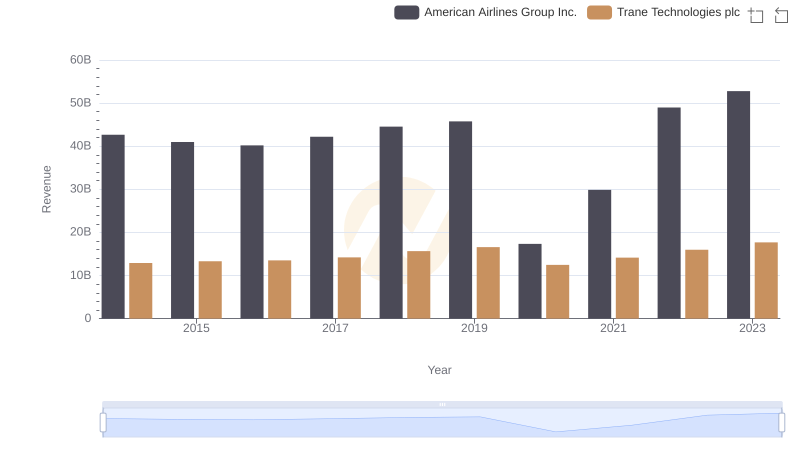
Trane Technologies plc vs American Airlines Group Inc.: Examining Key Revenue Metrics
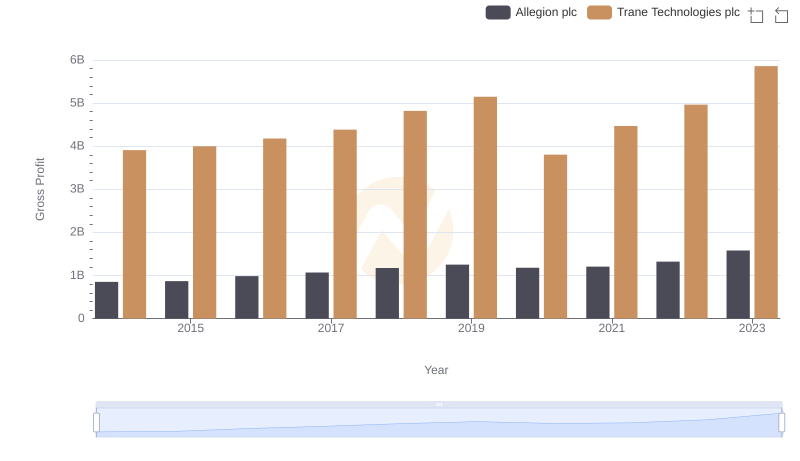
Gross Profit Analysis: Comparing Trane Technologies plc and Allegion plc
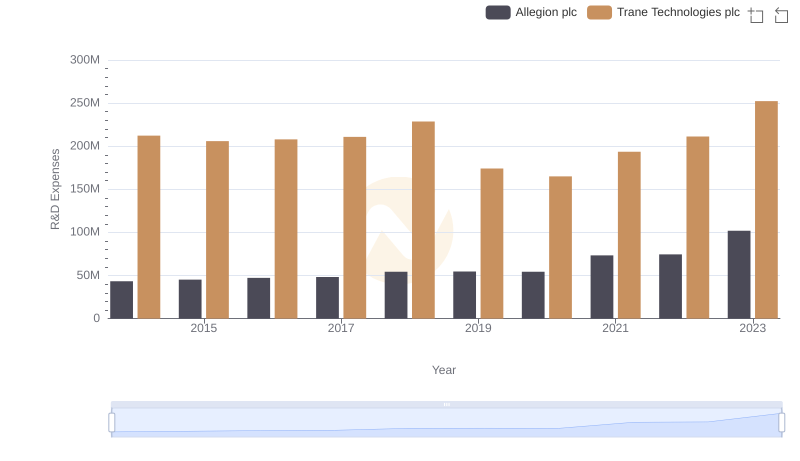
Research and Development: Comparing Key Metrics for Trane Technologies plc and Allegion plc
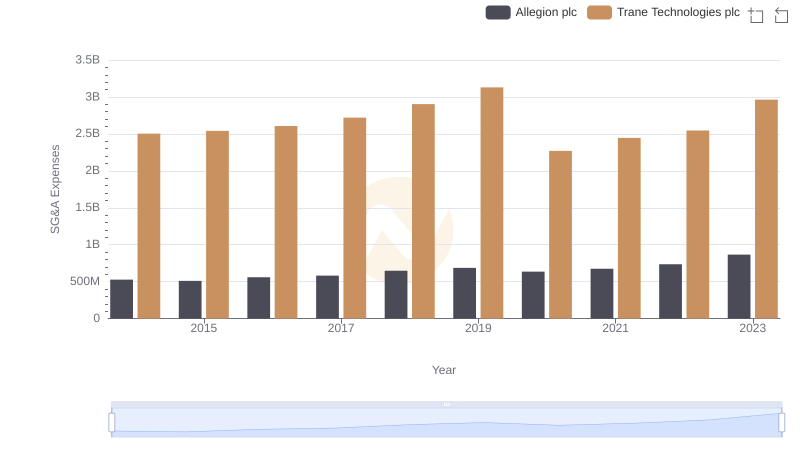
SG&A Efficiency Analysis: Comparing Trane Technologies plc and Allegion plc