| __timestamp | American Airlines Group Inc. | Trane Technologies plc |
|---|---|---|
| Wednesday, January 1, 2014 | 1544000000 | 2503900000 |
| Thursday, January 1, 2015 | 1394000000 | 2541100000 |
| Friday, January 1, 2016 | 1323000000 | 2606500000 |
| Sunday, January 1, 2017 | 1477000000 | 2720700000 |
| Monday, January 1, 2018 | 1520000000 | 2903200000 |
| Tuesday, January 1, 2019 | 1602000000 | 3129800000 |
| Wednesday, January 1, 2020 | 513000000 | 2270600000 |
| Friday, January 1, 2021 | 1098000000 | 2446300000 |
| Saturday, January 1, 2022 | 1815000000 | 2545900000 |
| Sunday, January 1, 2023 | 1799000000 | 2963200000 |
| Monday, January 1, 2024 | 3580400000 |
Infusing magic into the data realm
In the world of corporate finance, Selling, General, and Administrative (SG&A) expenses are a crucial indicator of a company's operational efficiency. Over the past decade, Trane Technologies plc and American Airlines Group Inc. have showcased contrasting trends in their SG&A expenses. From 2014 to 2023, Trane Technologies consistently outpaced American Airlines, with expenses peaking at nearly 3.13 billion in 2019. In contrast, American Airlines experienced a significant dip in 2020, with expenses dropping to just over 500 million, likely due to the pandemic's impact on the travel industry. However, by 2022, American Airlines rebounded, reaching approximately 1.82 billion. This comparison highlights the resilience and strategic management of these industry leaders, offering valuable insights into their financial health and adaptability in a rapidly changing economic landscape.
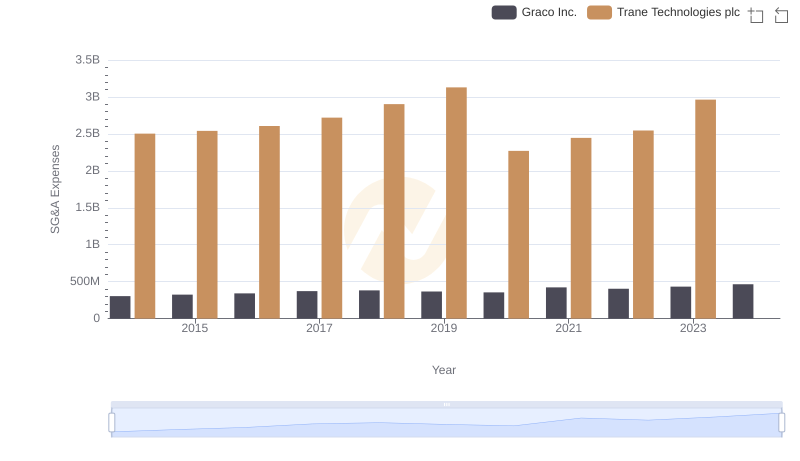
Breaking Down SG&A Expenses: Trane Technologies plc vs Graco Inc.
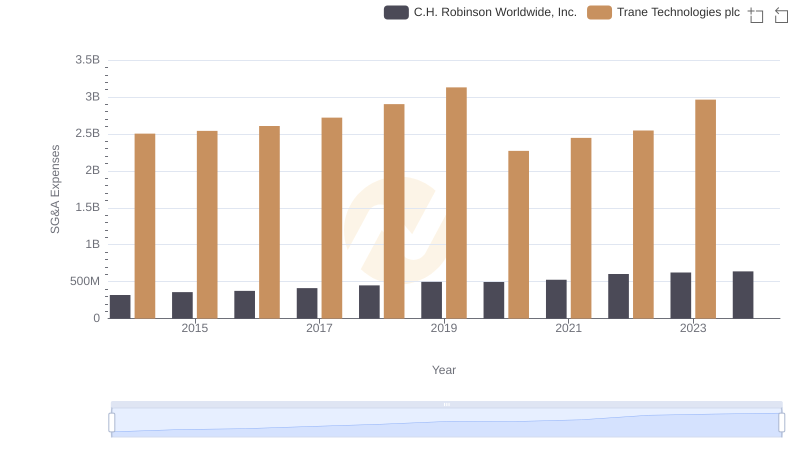
Trane Technologies plc and C.H. Robinson Worldwide, Inc.: SG&A Spending Patterns Compared
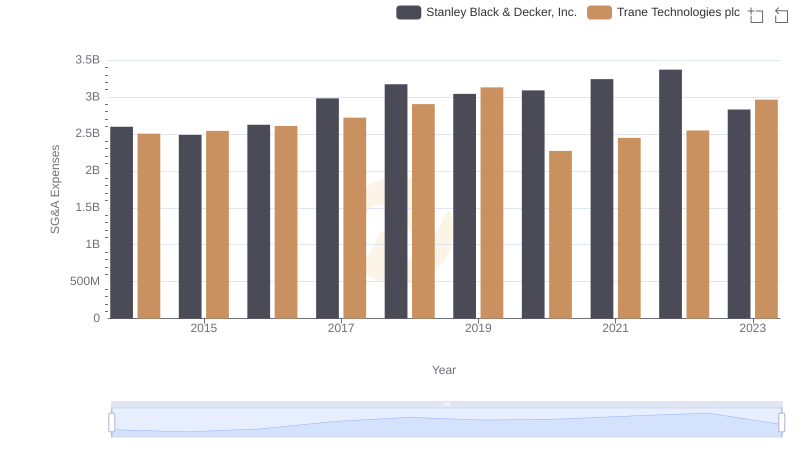
Comparing SG&A Expenses: Trane Technologies plc vs Stanley Black & Decker, Inc. Trends and Insights
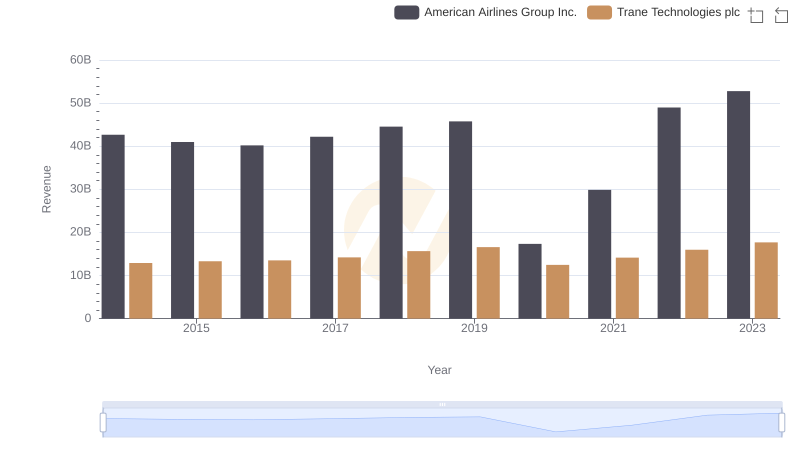
Trane Technologies plc vs American Airlines Group Inc.: Examining Key Revenue Metrics
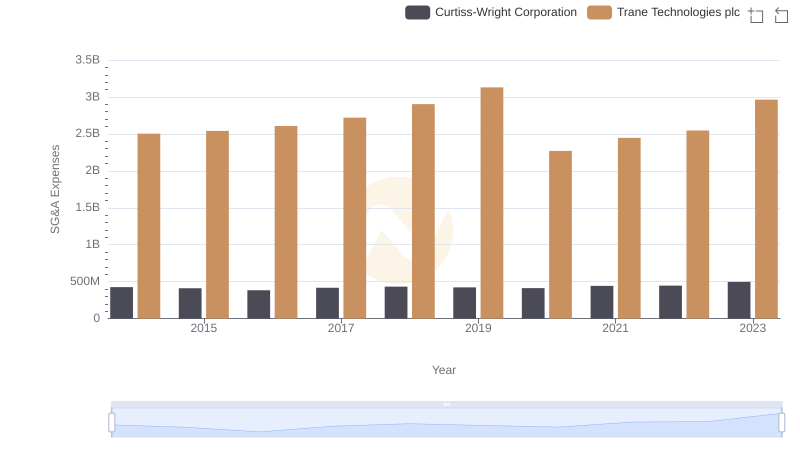
Trane Technologies plc vs Curtiss-Wright Corporation: SG&A Expense Trends
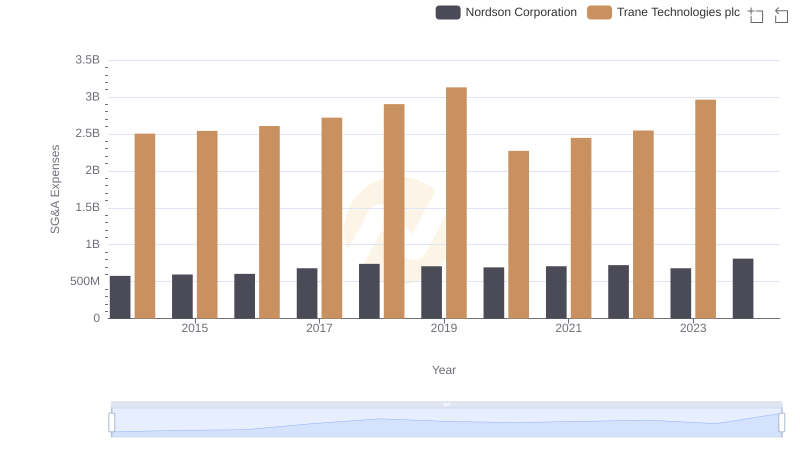
Trane Technologies plc or Nordson Corporation: Who Manages SG&A Costs Better?
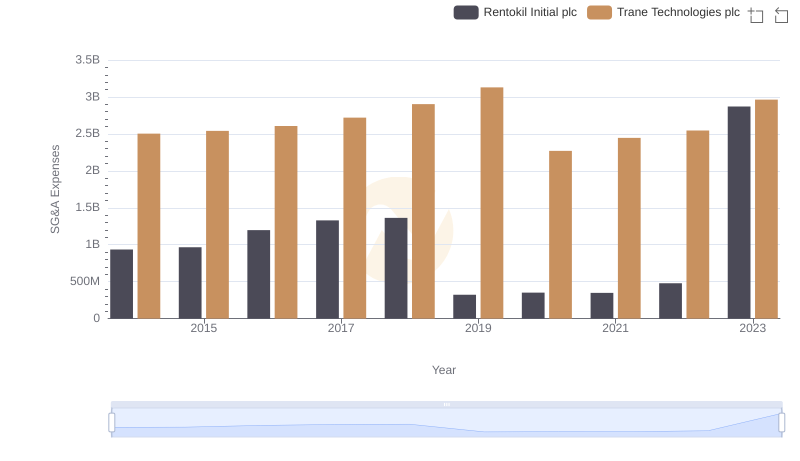
Cost Management Insights: SG&A Expenses for Trane Technologies plc and Rentokil Initial plc
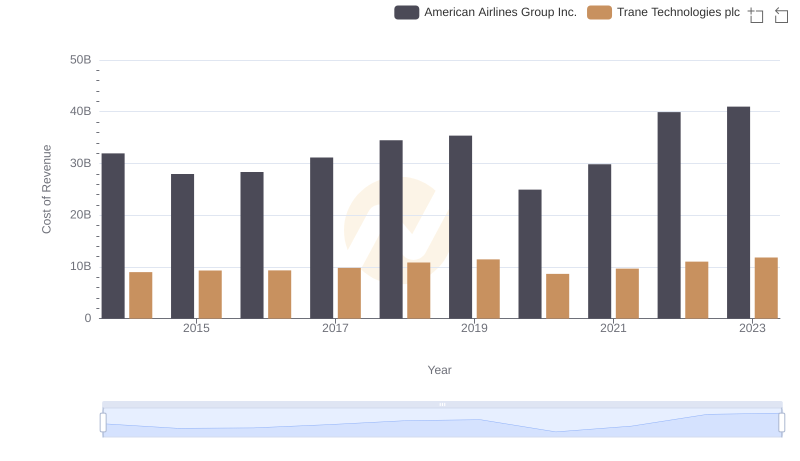
Analyzing Cost of Revenue: Trane Technologies plc and American Airlines Group Inc.
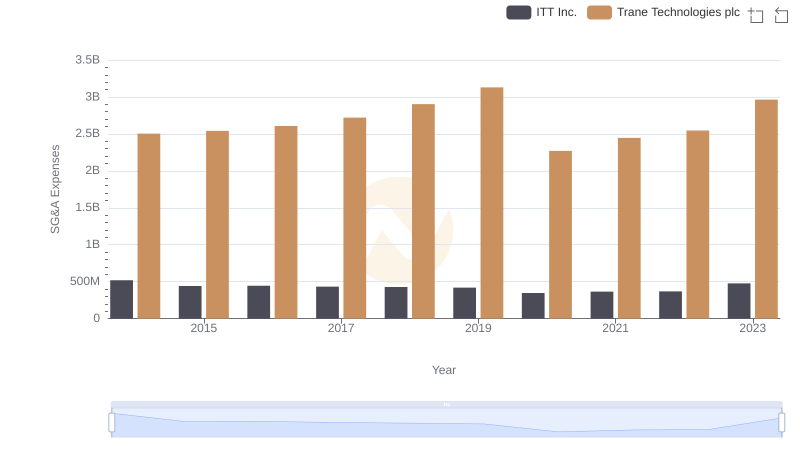
SG&A Efficiency Analysis: Comparing Trane Technologies plc and ITT Inc.
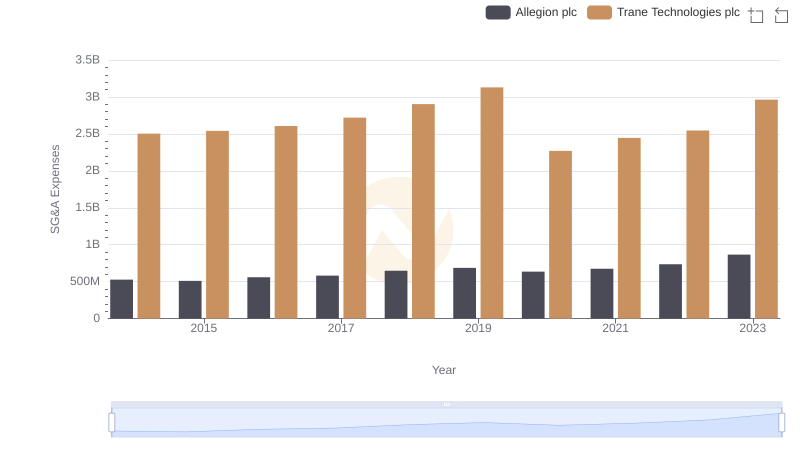
SG&A Efficiency Analysis: Comparing Trane Technologies plc and Allegion plc