| __timestamp | Allegion plc | Trane Technologies plc |
|---|---|---|
| Wednesday, January 1, 2014 | 853700000 | 3908600000 |
| Thursday, January 1, 2015 | 869100000 | 3999100000 |
| Friday, January 1, 2016 | 985300000 | 4179600000 |
| Sunday, January 1, 2017 | 1070700000 | 4386000000 |
| Monday, January 1, 2018 | 1173300000 | 4820600000 |
| Tuesday, January 1, 2019 | 1252300000 | 5147400000 |
| Wednesday, January 1, 2020 | 1178800000 | 3803400000 |
| Friday, January 1, 2021 | 1204900000 | 4469600000 |
| Saturday, January 1, 2022 | 1322400000 | 4964800000 |
| Sunday, January 1, 2023 | 1581500000 | 5857200000 |
| Monday, January 1, 2024 | 1668500000 | 7080500000 |
Unlocking the unknown
In the competitive landscape of industrial manufacturing, Trane Technologies plc and Allegion plc have demonstrated remarkable growth in gross profit over the past decade. From 2014 to 2023, Trane Technologies has consistently outperformed Allegion, with its gross profit increasing by approximately 50%, peaking at $5.86 billion in 2023. Allegion, while smaller in scale, has shown a robust growth trajectory, with a 85% increase in gross profit, reaching $1.58 billion in the same year.
This analysis highlights the resilience and strategic prowess of both companies in navigating market challenges. Trane Technologies' larger scale and diversified portfolio have enabled it to maintain a steady upward trend, while Allegion's focused approach in security solutions has driven its impressive growth. As the industrial sector continues to evolve, these companies are well-positioned to capitalize on emerging opportunities.
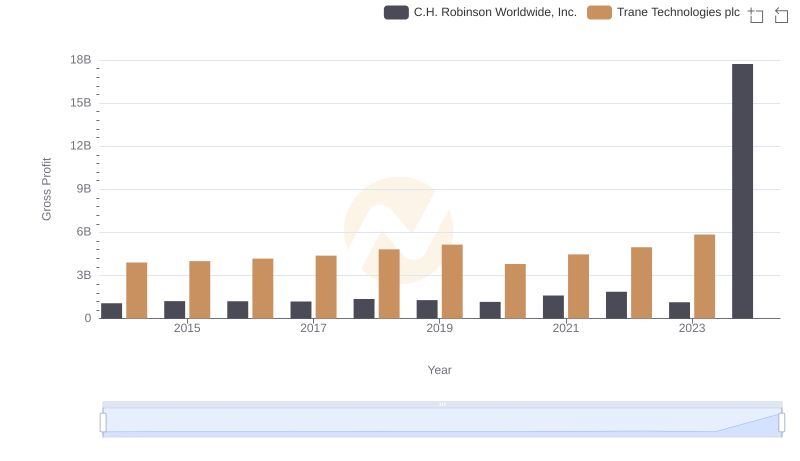
Who Generates Higher Gross Profit? Trane Technologies plc or C.H. Robinson Worldwide, Inc.
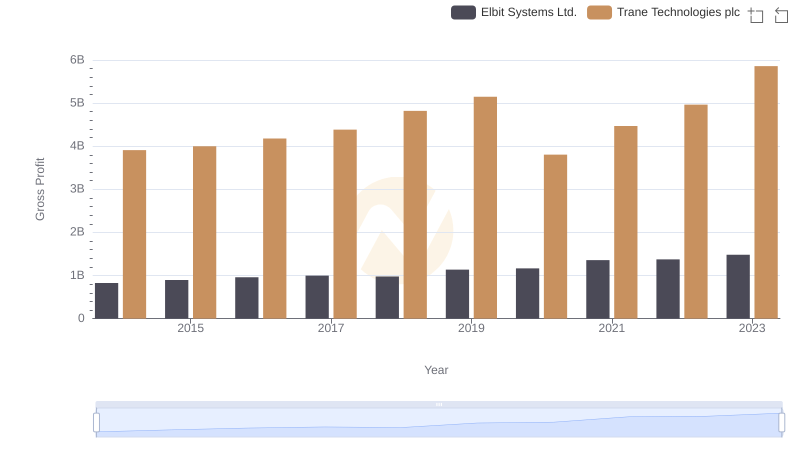
Key Insights on Gross Profit: Trane Technologies plc vs Elbit Systems Ltd.
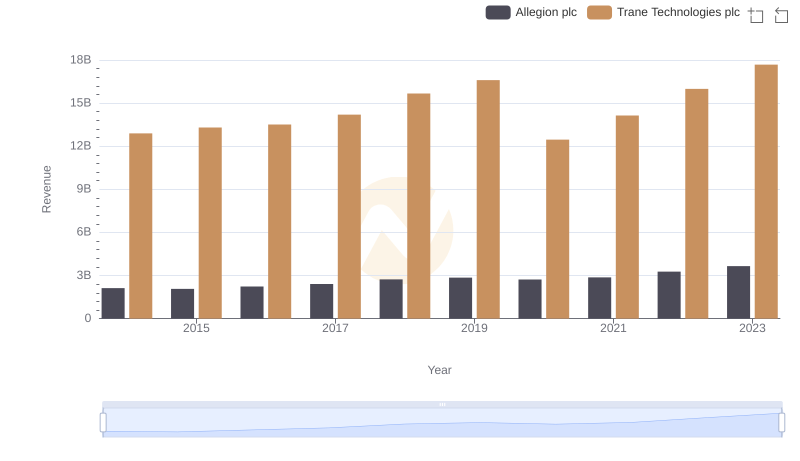
Breaking Down Revenue Trends: Trane Technologies plc vs Allegion plc
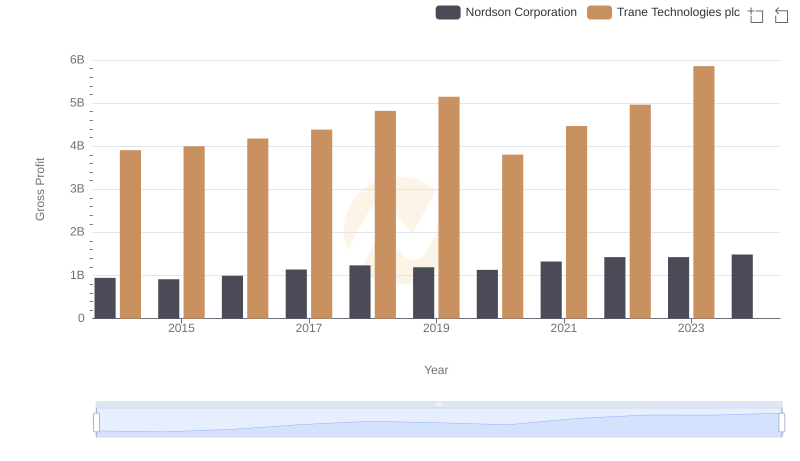
Key Insights on Gross Profit: Trane Technologies plc vs Nordson Corporation
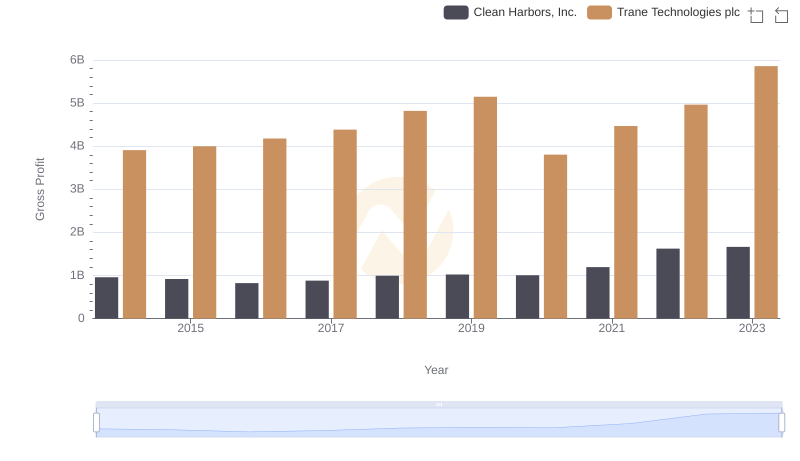
Key Insights on Gross Profit: Trane Technologies plc vs Clean Harbors, Inc.
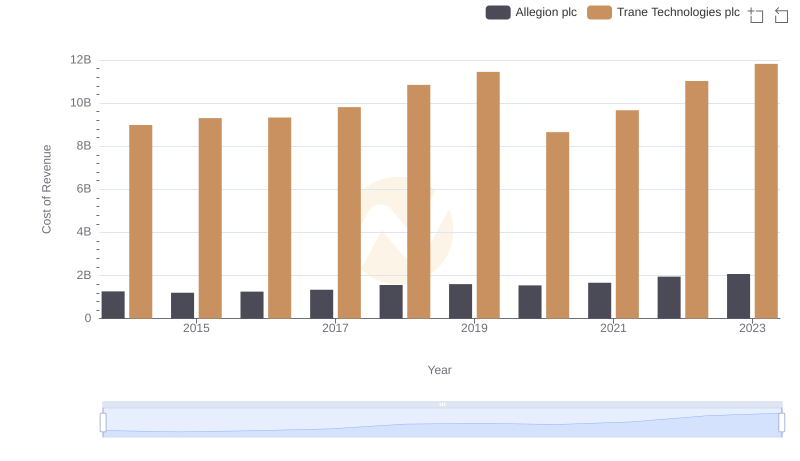
Cost of Revenue: Key Insights for Trane Technologies plc and Allegion plc
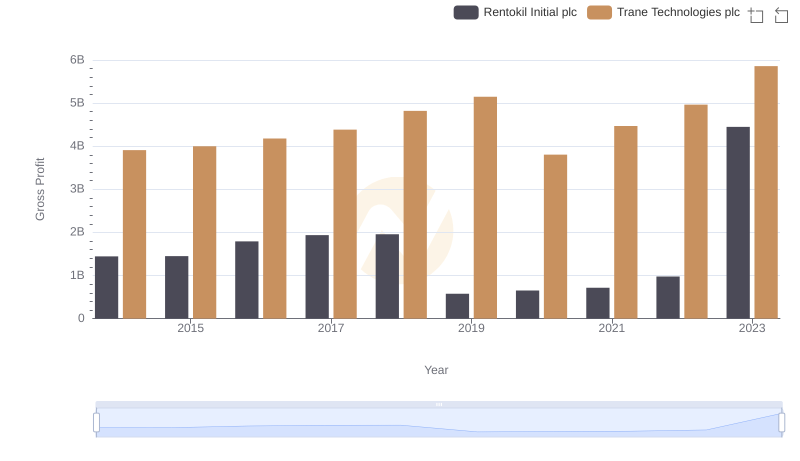
Gross Profit Comparison: Trane Technologies plc and Rentokil Initial plc Trends
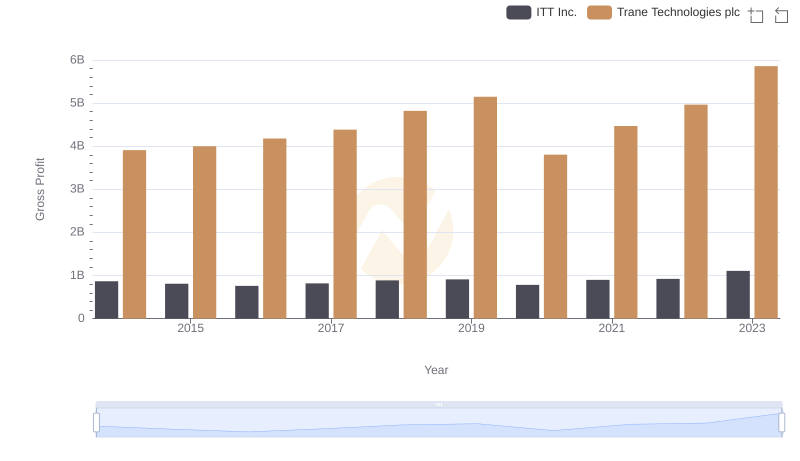
Gross Profit Analysis: Comparing Trane Technologies plc and ITT Inc.
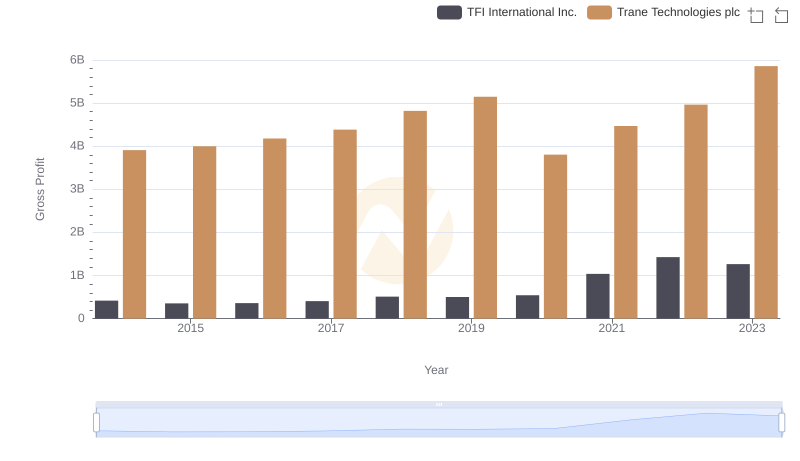
Trane Technologies plc vs TFI International Inc.: A Gross Profit Performance Breakdown
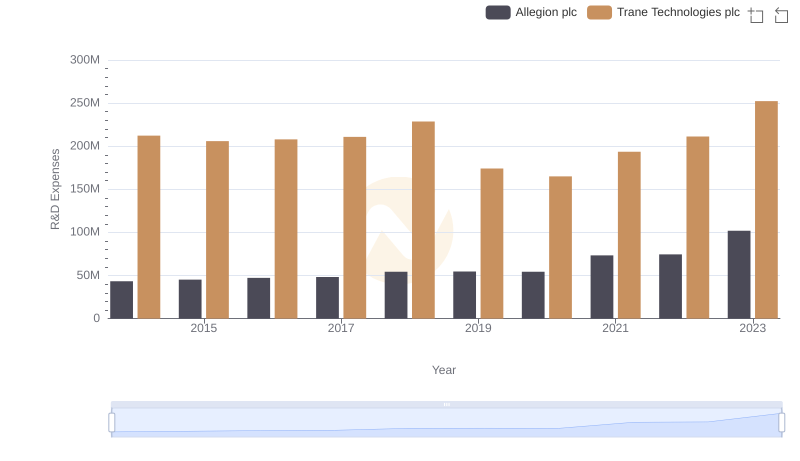
Research and Development: Comparing Key Metrics for Trane Technologies plc and Allegion plc
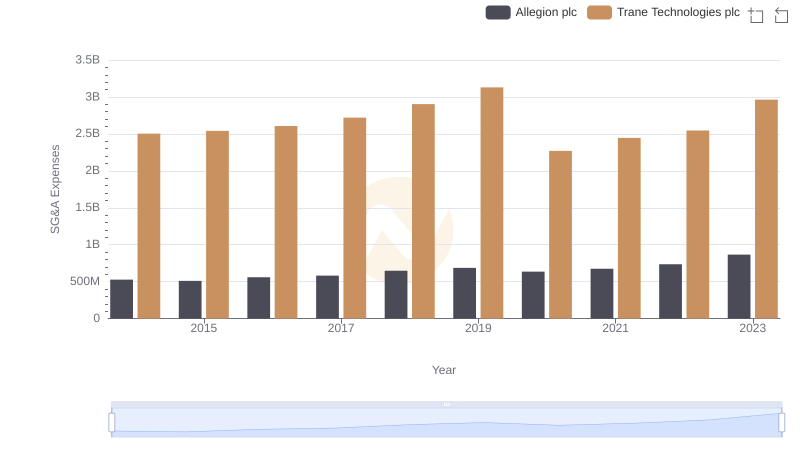
SG&A Efficiency Analysis: Comparing Trane Technologies plc and Allegion plc