| __timestamp | Carlisle Companies Incorporated | Waste Connections, Inc. |
|---|---|---|
| Wednesday, January 1, 2014 | 379000000 | 229474000 |
| Thursday, January 1, 2015 | 461900000 | 237484000 |
| Friday, January 1, 2016 | 532000000 | 474263000 |
| Sunday, January 1, 2017 | 589400000 | 509638000 |
| Monday, January 1, 2018 | 625400000 | 524388000 |
| Tuesday, January 1, 2019 | 667100000 | 546278000 |
| Wednesday, January 1, 2020 | 603200000 | 537632000 |
| Friday, January 1, 2021 | 698200000 | 612337000 |
| Saturday, January 1, 2022 | 811500000 | 696467000 |
| Sunday, January 1, 2023 | 625200000 | 799119000 |
| Monday, January 1, 2024 | 722800000 | 883445000 |
Unleashing the power of data
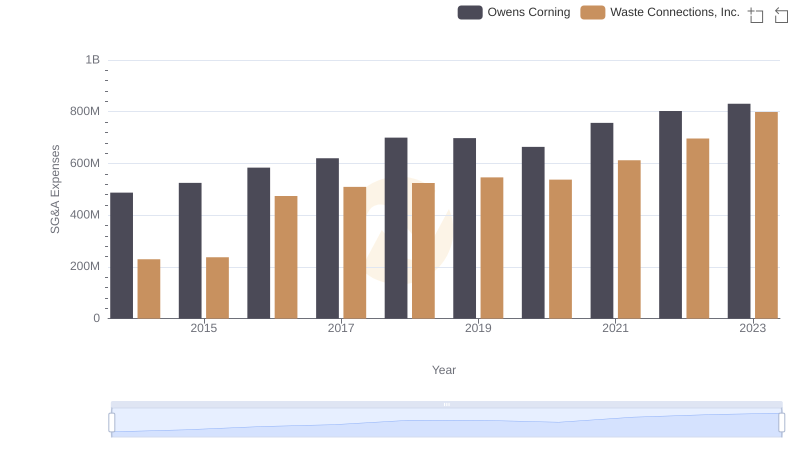
In the ever-evolving landscape of corporate finance, Selling, General, and Administrative (SG&A) expenses serve as a critical indicator of operational efficiency. Over the past decade, from 2014 to 2023, Waste Connections, Inc. and Carlisle Companies Incorporated have demonstrated intriguing trends in their SG&A expenditures.
Carlisle Companies: Starting at 38% of its 2023 value in 2014, Carlisle's SG&A expenses peaked in 2022, showing a 114% increase over the decade. However, 2023 saw a 23% drop from the previous year, indicating potential cost optimization or strategic shifts.
Waste Connections: This company exhibited a steady rise, with SG&A costs growing by 248% from 2014 to 2023. Notably, 2023 marked a 15% increase from 2022, reflecting ongoing expansion efforts.
These trends highlight the dynamic nature of corporate strategies in managing operational costs, offering valuable insights for investors and analysts alike.
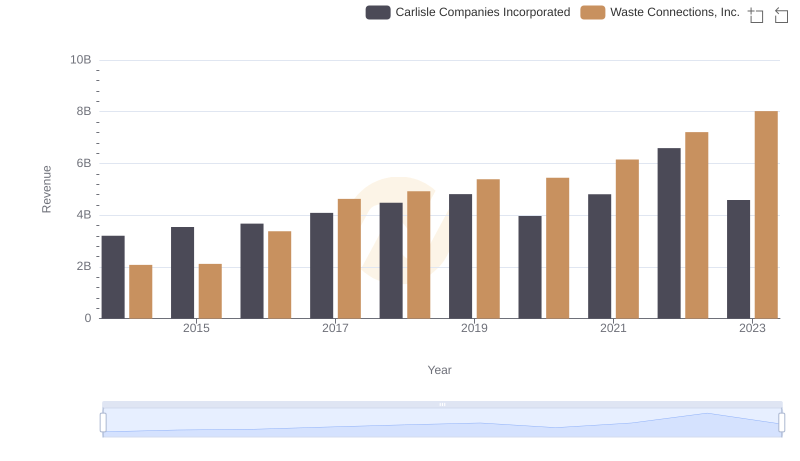
Revenue Showdown: Waste Connections, Inc. vs Carlisle Companies Incorporated
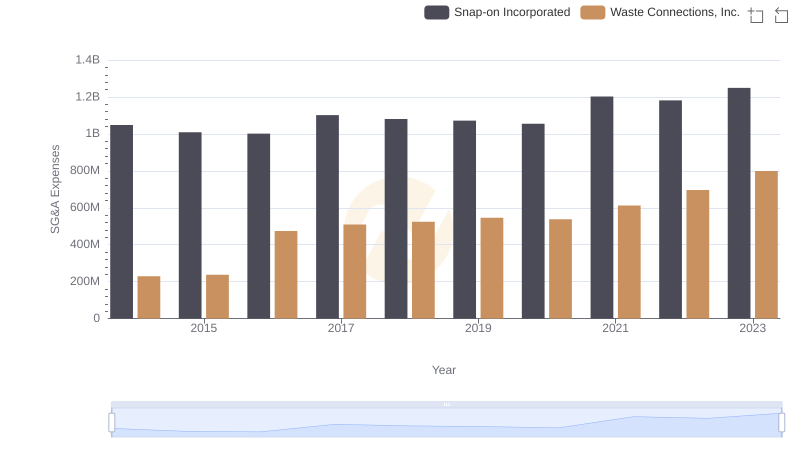
Operational Costs Compared: SG&A Analysis of Waste Connections, Inc. and Snap-on Incorporated
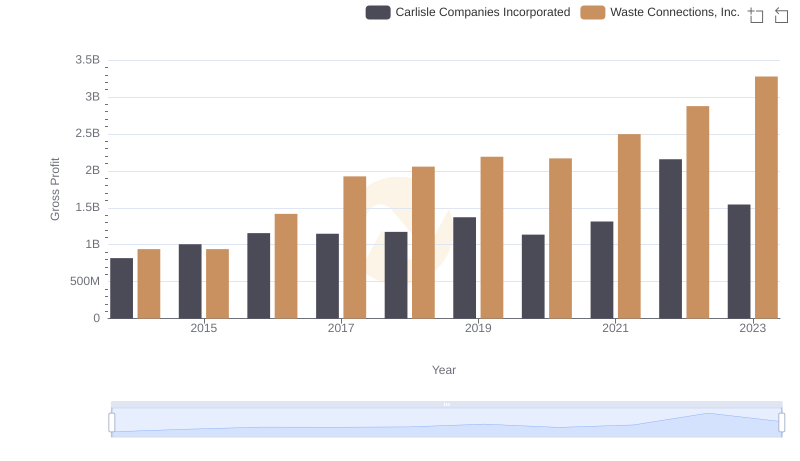
Gross Profit Analysis: Comparing Waste Connections, Inc. and Carlisle Companies Incorporated
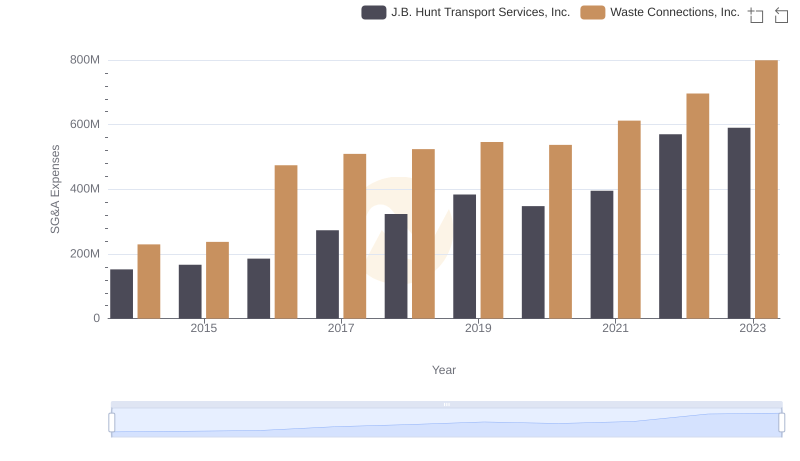
Cost Management Insights: SG&A Expenses for Waste Connections, Inc. and J.B. Hunt Transport Services, Inc.
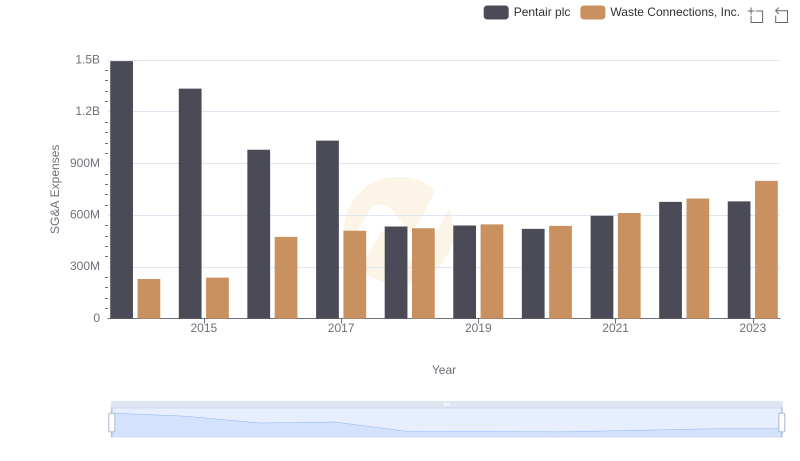
SG&A Efficiency Analysis: Comparing Waste Connections, Inc. and Pentair plc
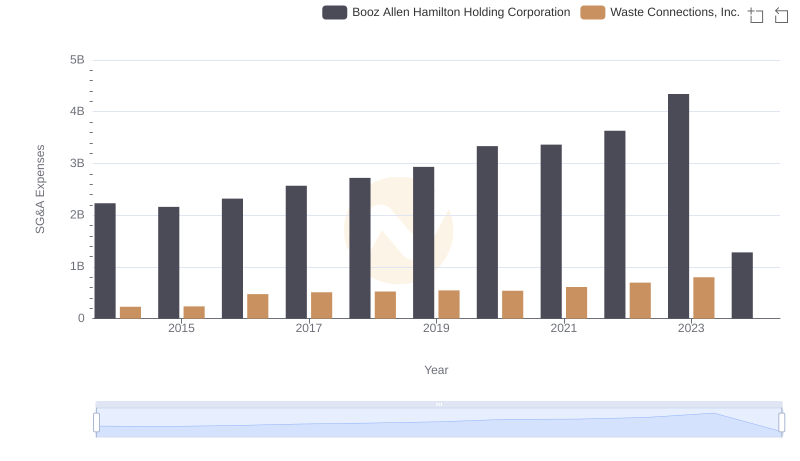
Who Optimizes SG&A Costs Better? Waste Connections, Inc. or Booz Allen Hamilton Holding Corporation
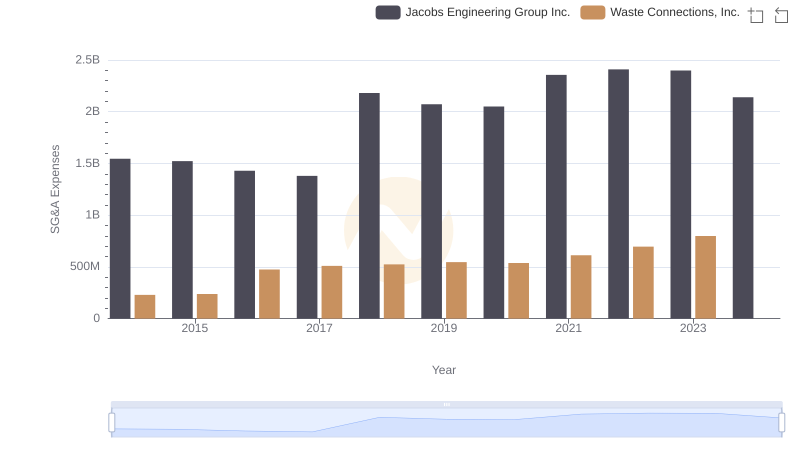
SG&A Efficiency Analysis: Comparing Waste Connections, Inc. and Jacobs Engineering Group Inc.
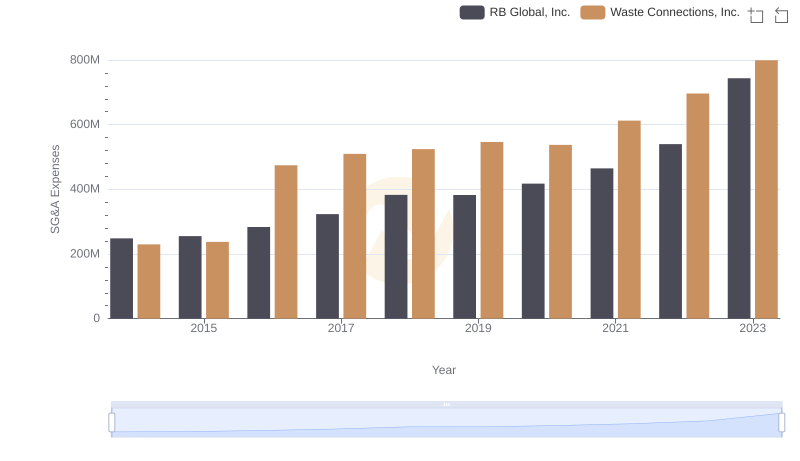
Waste Connections, Inc. vs RB Global, Inc.: SG&A Expense Trends
Who Optimizes SG&A Costs Better? Waste Connections, Inc. or Owens Corning