| __timestamp | RB Global, Inc. | United Airlines Holdings, Inc. |
|---|---|---|
| Wednesday, January 1, 2014 | 248220000 | 1373000000 |
| Thursday, January 1, 2015 | 254990000 | 1342000000 |
| Friday, January 1, 2016 | 283529000 | 1303000000 |
| Sunday, January 1, 2017 | 323270000 | 1349000000 |
| Monday, January 1, 2018 | 382676000 | 1558000000 |
| Tuesday, January 1, 2019 | 382389000 | 1651000000 |
| Wednesday, January 1, 2020 | 417523000 | 459000000 |
| Friday, January 1, 2021 | 464599000 | 677000000 |
| Saturday, January 1, 2022 | 539933000 | 1535000000 |
| Sunday, January 1, 2023 | 743700000 | 1977000000 |
| Monday, January 1, 2024 | 773900000 | 2231000000 |
Igniting the spark of knowledge
In the ever-evolving landscape of corporate finance, understanding the trends in Selling, General, and Administrative (SG&A) expenses is crucial for investors and analysts alike. Over the past decade, United Airlines Holdings, Inc. and RB Global, Inc. have showcased distinct trajectories in their SG&A expenditures.
From 2014 to 2023, United Airlines consistently reported higher SG&A expenses, peaking at nearly $2 billion in 2023, a 44% increase from 2014. This reflects the airline's strategic investments in customer service and operational efficiency. In contrast, RB Global's SG&A expenses grew by approximately 200% over the same period, reaching $743 million in 2023. This surge highlights the company's aggressive expansion and marketing strategies.
These trends underscore the differing priorities and growth strategies of these industry giants, offering valuable insights for stakeholders aiming to navigate the complexities of the stock market.
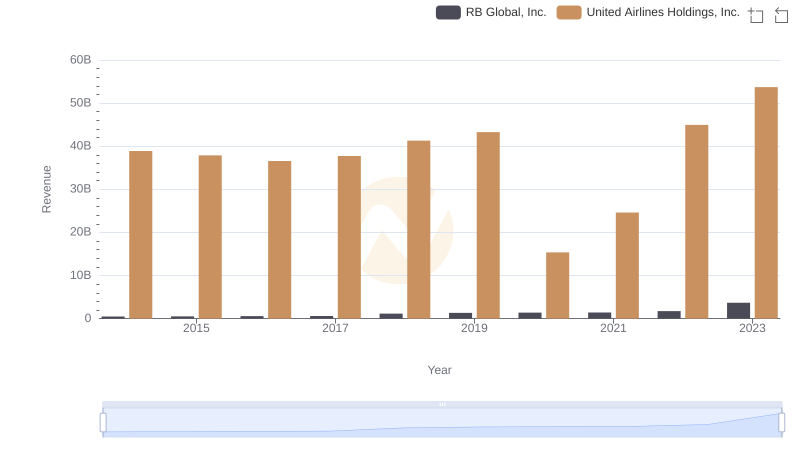
Revenue Insights: United Airlines Holdings, Inc. and RB Global, Inc. Performance Compared
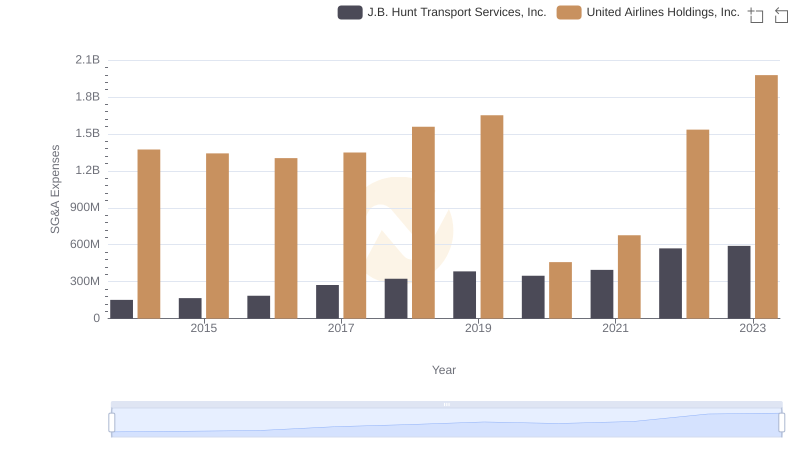
Who Optimizes SG&A Costs Better? United Airlines Holdings, Inc. or J.B. Hunt Transport Services, Inc.
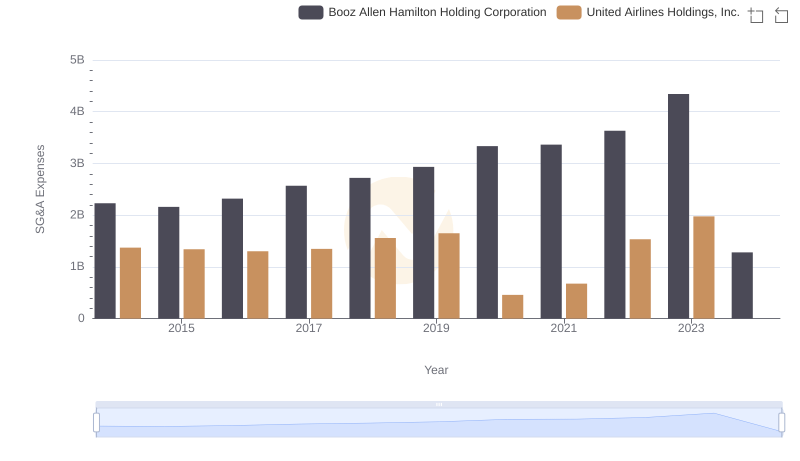
United Airlines Holdings, Inc. or Booz Allen Hamilton Holding Corporation: Who Manages SG&A Costs Better?
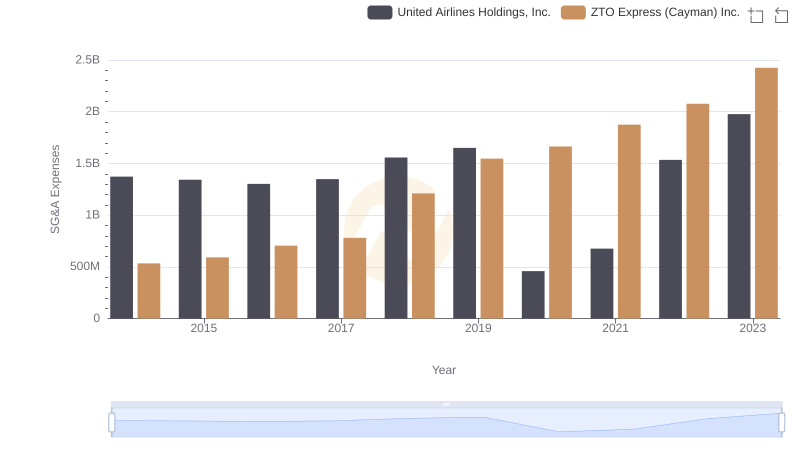
Selling, General, and Administrative Costs: United Airlines Holdings, Inc. vs ZTO Express (Cayman) Inc.