| __timestamp | Booz Allen Hamilton Holding Corporation | United Airlines Holdings, Inc. |
|---|---|---|
| Wednesday, January 1, 2014 | 2229642000 | 1373000000 |
| Thursday, January 1, 2015 | 2159439000 | 1342000000 |
| Friday, January 1, 2016 | 2319592000 | 1303000000 |
| Sunday, January 1, 2017 | 2568511000 | 1349000000 |
| Monday, January 1, 2018 | 2719909000 | 1558000000 |
| Tuesday, January 1, 2019 | 2932602000 | 1651000000 |
| Wednesday, January 1, 2020 | 3334378000 | 459000000 |
| Friday, January 1, 2021 | 3362722000 | 677000000 |
| Saturday, January 1, 2022 | 3633150000 | 1535000000 |
| Sunday, January 1, 2023 | 4341769000 | 1977000000 |
| Monday, January 1, 2024 | 1281443000 | 2231000000 |
Unveiling the hidden dimensions of data
In the competitive world of corporate finance, managing Selling, General, and Administrative (SG&A) expenses is crucial for profitability. From 2014 to 2023, Booz Allen Hamilton Holding Corporation consistently outperformed United Airlines Holdings, Inc. in controlling these costs. Booz Allen's SG&A expenses grew by approximately 95%, from $2.23 billion in 2014 to $4.34 billion in 2023. In contrast, United Airlines saw a more volatile trend, with a significant dip in 2020, likely due to the pandemic, and a recovery to $1.98 billion by 2023. This represents a 44% increase from their 2014 figures. The data suggests that Booz Allen's strategic management of SG&A expenses has been more stable and effective over the years, providing a competitive edge in financial efficiency.
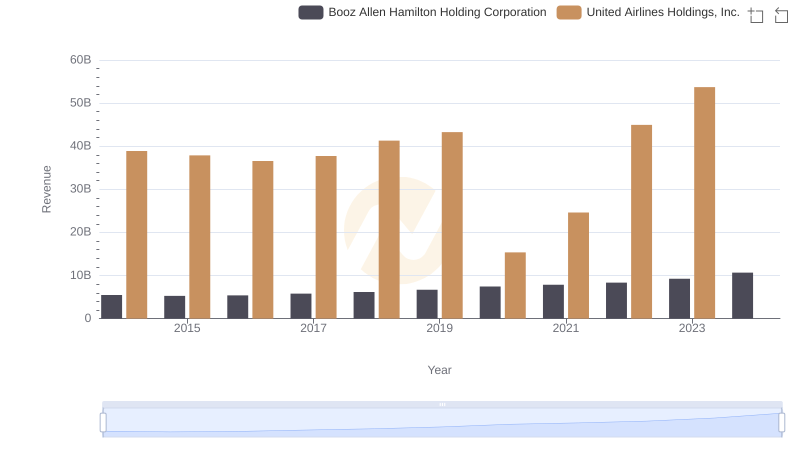
Who Generates More Revenue? United Airlines Holdings, Inc. or Booz Allen Hamilton Holding Corporation
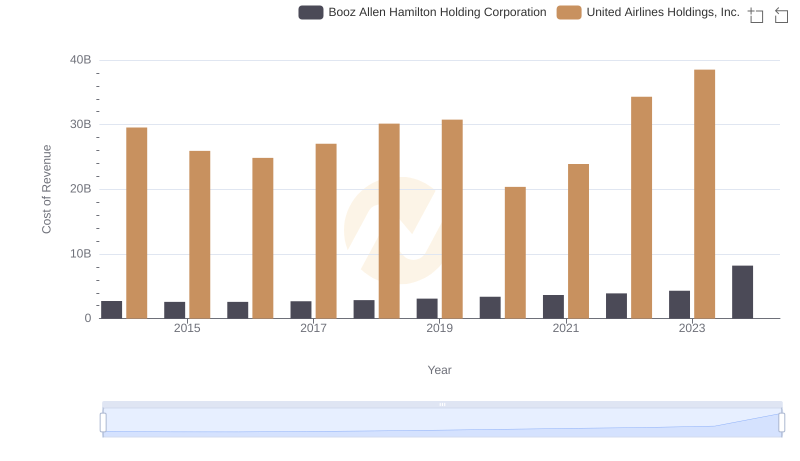
Cost of Revenue Trends: United Airlines Holdings, Inc. vs Booz Allen Hamilton Holding Corporation
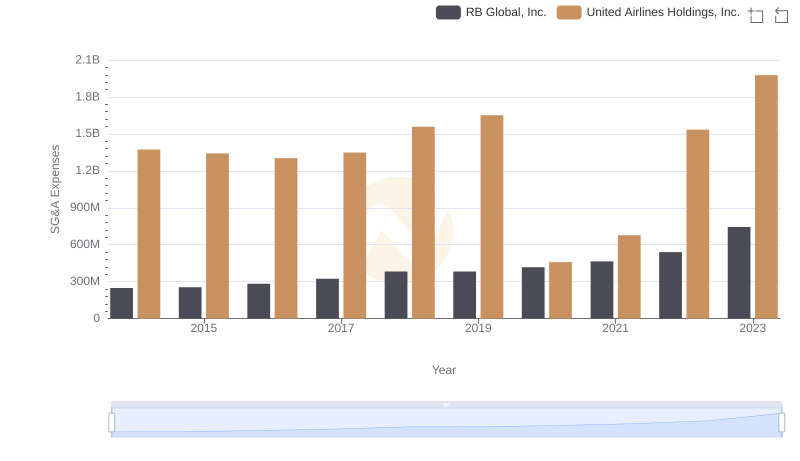
United Airlines Holdings, Inc. vs RB Global, Inc.: SG&A Expense Trends
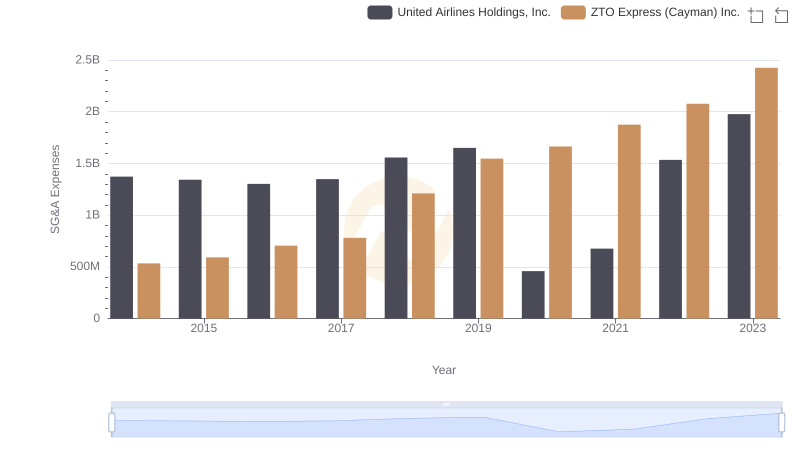
Selling, General, and Administrative Costs: United Airlines Holdings, Inc. vs ZTO Express (Cayman) Inc.