| __timestamp | American Airlines Group Inc. | Trane Technologies plc |
|---|---|---|
| Wednesday, January 1, 2014 | 42650000000 | 12891400000 |
| Thursday, January 1, 2015 | 40990000000 | 13300700000 |
| Friday, January 1, 2016 | 40180000000 | 13508900000 |
| Sunday, January 1, 2017 | 42207000000 | 14197600000 |
| Monday, January 1, 2018 | 44541000000 | 15668200000 |
| Tuesday, January 1, 2019 | 45768000000 | 16598900000 |
| Wednesday, January 1, 2020 | 17337000000 | 12454700000 |
| Friday, January 1, 2021 | 29882000000 | 14136400000 |
| Saturday, January 1, 2022 | 48971000000 | 15991700000 |
| Sunday, January 1, 2023 | 52788000000 | 17677600000 |
| Monday, January 1, 2024 | 19838200000 |
Igniting the spark of knowledge
In the ever-evolving landscape of American industry, Trane Technologies and American Airlines stand as titans in their respective fields. Over the past decade, these companies have navigated economic shifts, technological advancements, and global challenges. From 2014 to 2023, American Airlines' revenue soared by approximately 24%, peaking in 2023, despite a significant dip in 2020 due to the pandemic. Meanwhile, Trane Technologies, a leader in climate solutions, saw a steady revenue growth of about 37% over the same period, reflecting its resilience and adaptability.
The data reveals a compelling narrative of recovery and growth. American Airlines' revenue rebounded sharply post-2020, while Trane Technologies consistently expanded its market presence. This comparison not only highlights the dynamic nature of these industries but also underscores the strategic maneuvers that have propelled these companies forward.
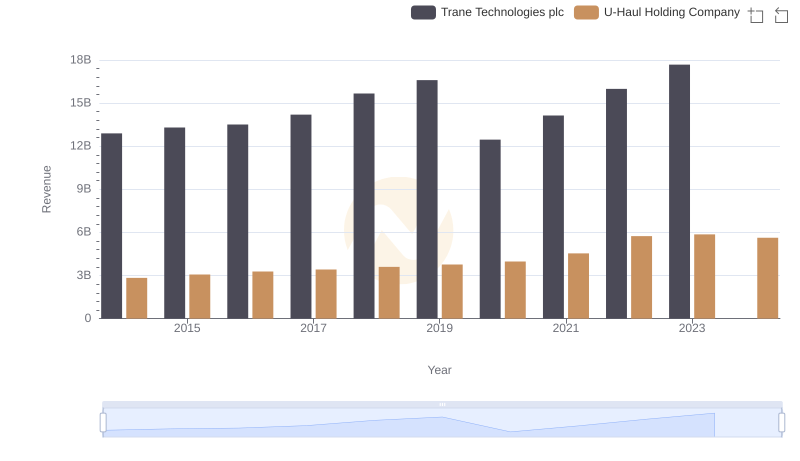
Annual Revenue Comparison: Trane Technologies plc vs U-Haul Holding Company
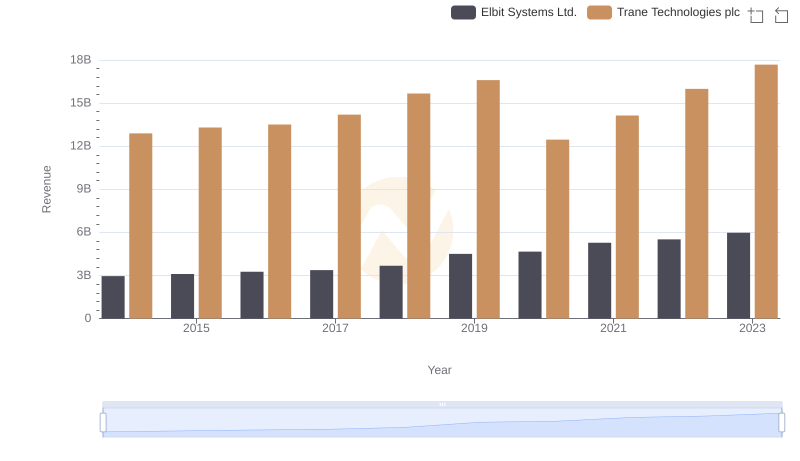
Trane Technologies plc vs Elbit Systems Ltd.: Annual Revenue Growth Compared
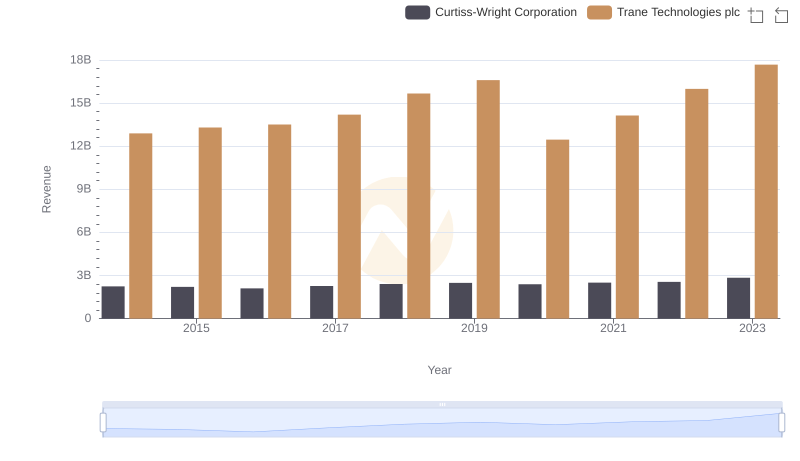
Comparing Revenue Performance: Trane Technologies plc or Curtiss-Wright Corporation?
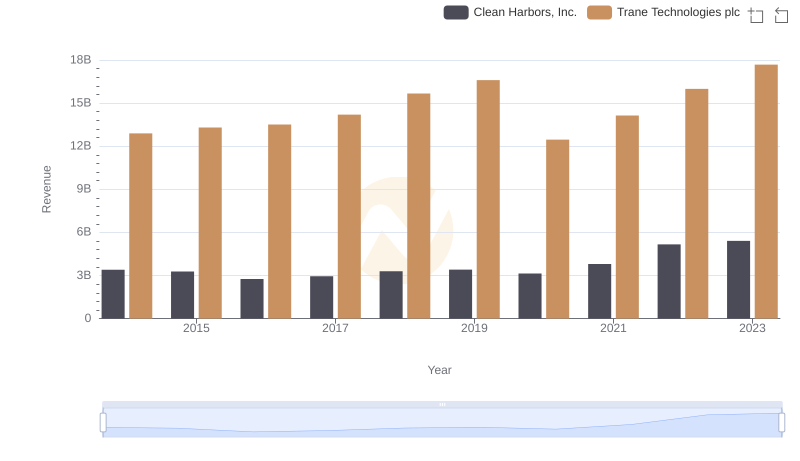
Breaking Down Revenue Trends: Trane Technologies plc vs Clean Harbors, Inc.
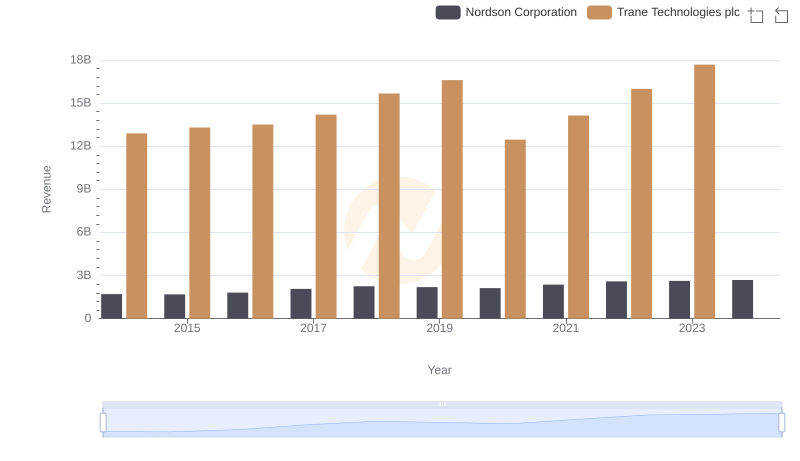
Trane Technologies plc vs Nordson Corporation: Examining Key Revenue Metrics
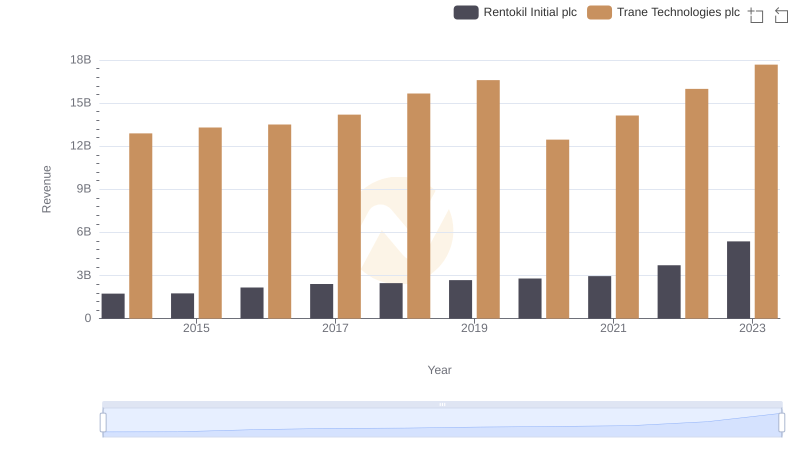
Revenue Showdown: Trane Technologies plc vs Rentokil Initial plc
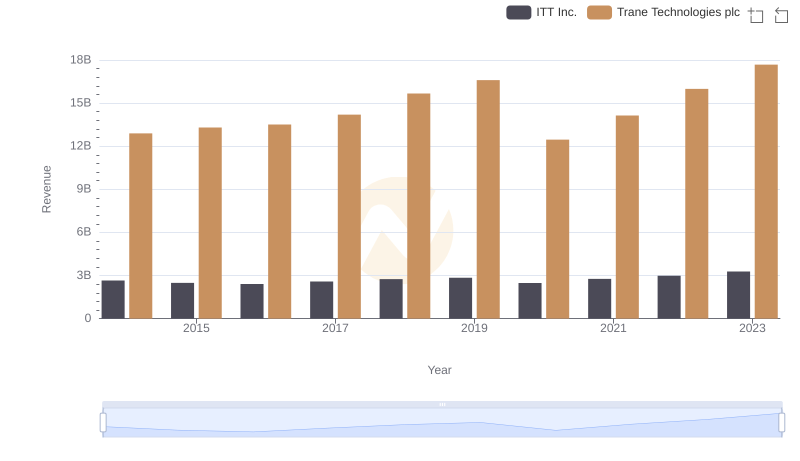
Comparing Revenue Performance: Trane Technologies plc or ITT Inc.?

Trane Technologies plc vs TFI International Inc.: Examining Key Revenue Metrics
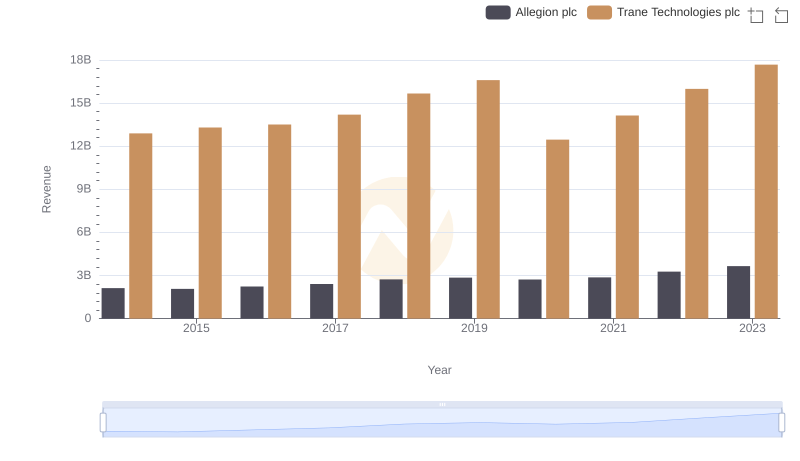
Breaking Down Revenue Trends: Trane Technologies plc vs Allegion plc
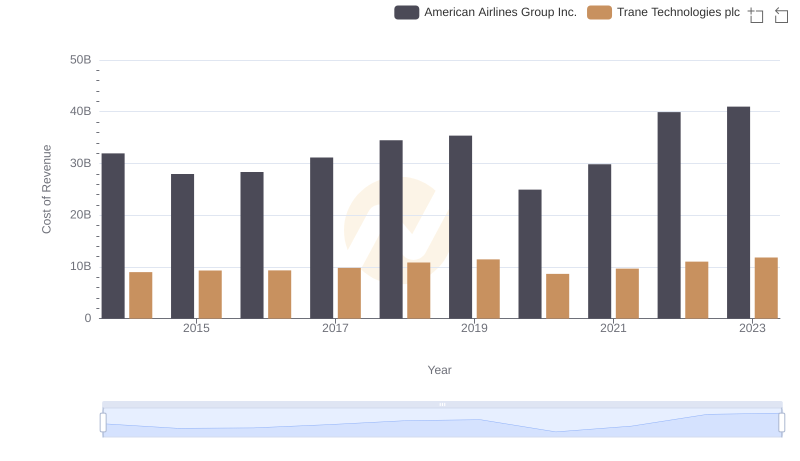
Analyzing Cost of Revenue: Trane Technologies plc and American Airlines Group Inc.
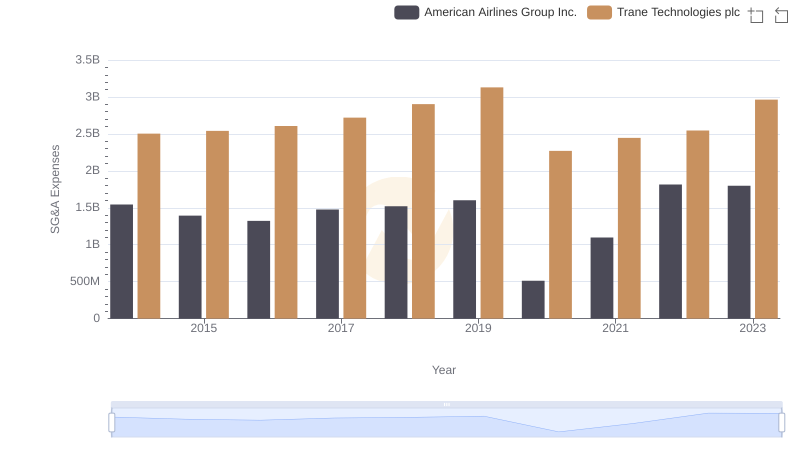
Selling, General, and Administrative Costs: Trane Technologies plc vs American Airlines Group Inc.