| __timestamp | ASE Technology Holding Co., Ltd. | Seagate Technology Holdings plc |
|---|---|---|
| Wednesday, January 1, 2014 | 13673000000 | 722000000 |
| Thursday, January 1, 2015 | 14295000000 | 857000000 |
| Friday, January 1, 2016 | 15099000000 | 635000000 |
| Sunday, January 1, 2017 | 15767000000 | 606000000 |
| Monday, January 1, 2018 | 19552000000 | 562000000 |
| Tuesday, January 1, 2019 | 22389000000 | 453000000 |
| Wednesday, January 1, 2020 | 23806000000 | 473000000 |
| Friday, January 1, 2021 | 27191000000 | 502000000 |
| Saturday, January 1, 2022 | 30384000000 | 559000000 |
| Sunday, January 1, 2023 | 25930017000 | 491000000 |
| Monday, January 1, 2024 | 27353513000 | 460000000 |
Unveiling the hidden dimensions of data
In the ever-evolving landscape of technology, understanding the financial strategies of industry leaders is crucial. This chart provides a fascinating glimpse into the Selling, General, and Administrative (SG&A) expenses of Seagate Technology Holdings plc and ASE Technology Holding Co., Ltd. over the past decade. From 2014 to 2023, ASE Technology's SG&A expenses have shown a remarkable upward trend, peaking in 2022 with a 122% increase from 2014. In contrast, Seagate's expenses have remained relatively stable, with a slight decline of around 36% over the same period.
This divergence highlights the contrasting business strategies of these two tech giants. While ASE Technology has aggressively expanded its administrative and sales efforts, Seagate has maintained a more conservative approach. The data for 2024 is incomplete, offering a tantalizing glimpse into the future financial maneuvers of these companies.
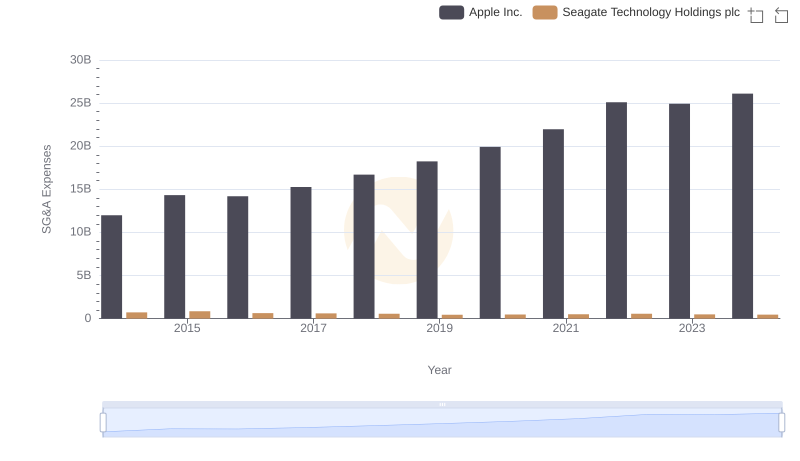
Apple Inc. and Seagate Technology Holdings plc: SG&A Spending Patterns Compared
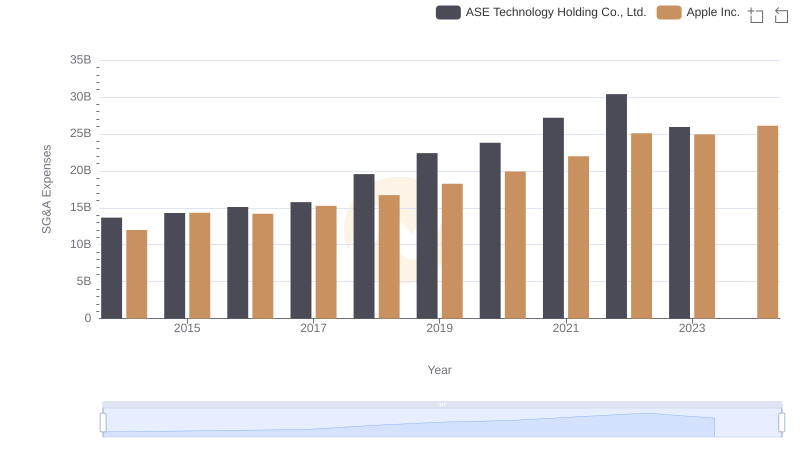
Apple Inc. vs ASE Technology Holding Co., Ltd.: SG&A Expense Trends
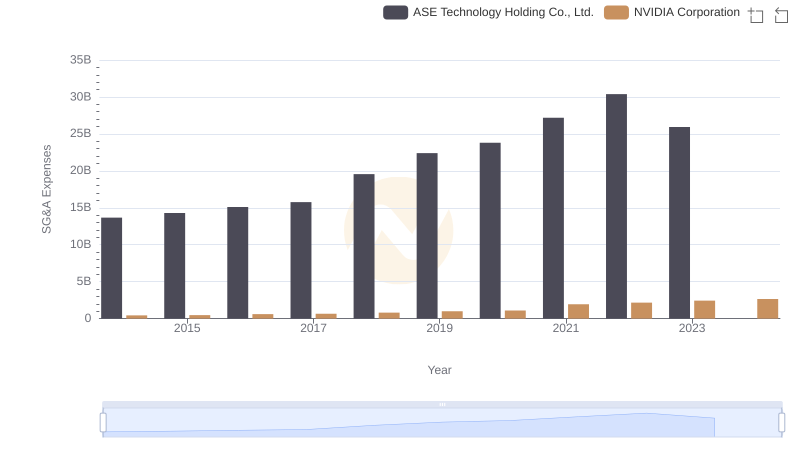
Operational Costs Compared: SG&A Analysis of NVIDIA Corporation and ASE Technology Holding Co., Ltd.
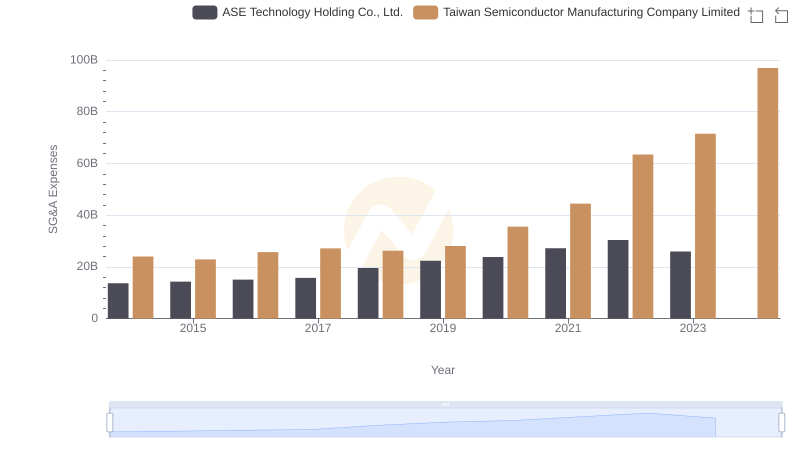
Who Optimizes SG&A Costs Better? Taiwan Semiconductor Manufacturing Company Limited or ASE Technology Holding Co., Ltd.
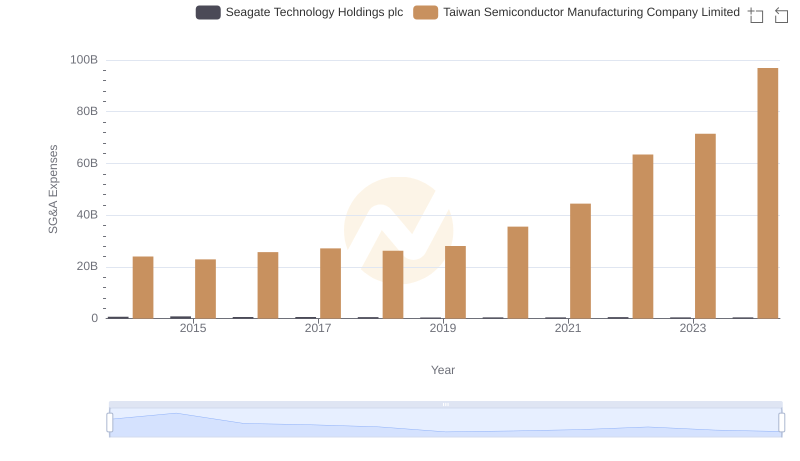
Taiwan Semiconductor Manufacturing Company Limited and Seagate Technology Holdings plc: SG&A Spending Patterns Compared
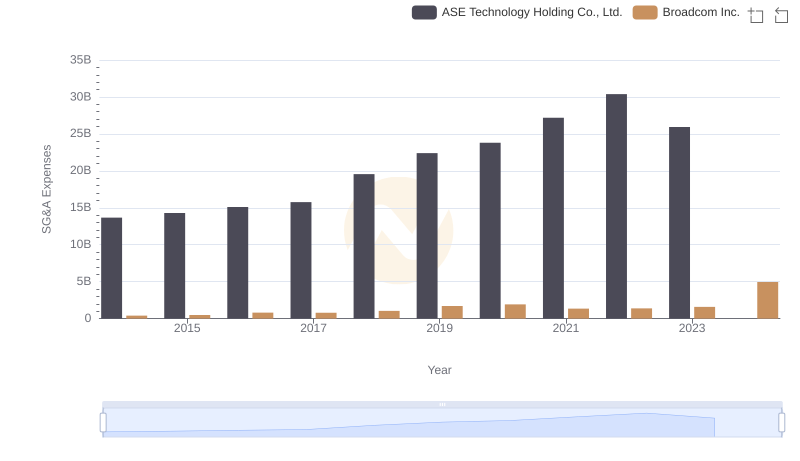
Breaking Down SG&A Expenses: Broadcom Inc. vs ASE Technology Holding Co., Ltd.
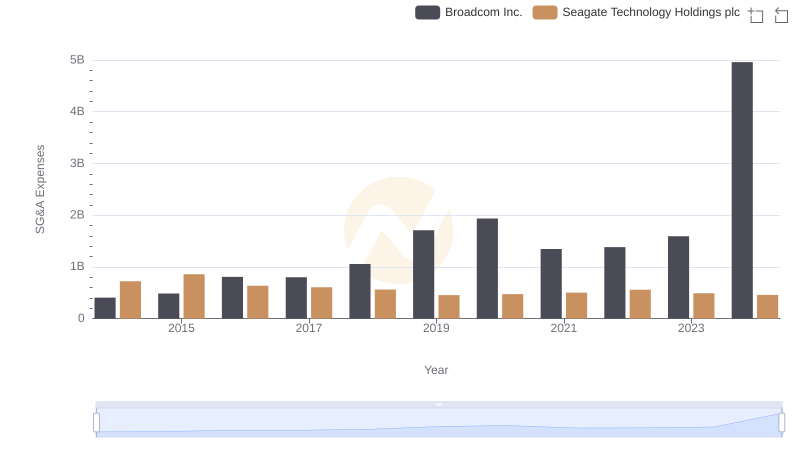
Who Optimizes SG&A Costs Better? Broadcom Inc. or Seagate Technology Holdings plc
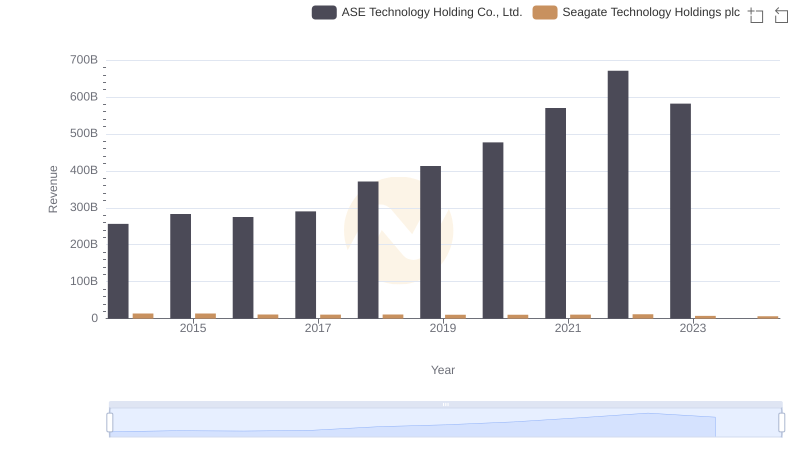
Seagate Technology Holdings plc and ASE Technology Holding Co., Ltd.: A Comprehensive Revenue Analysis
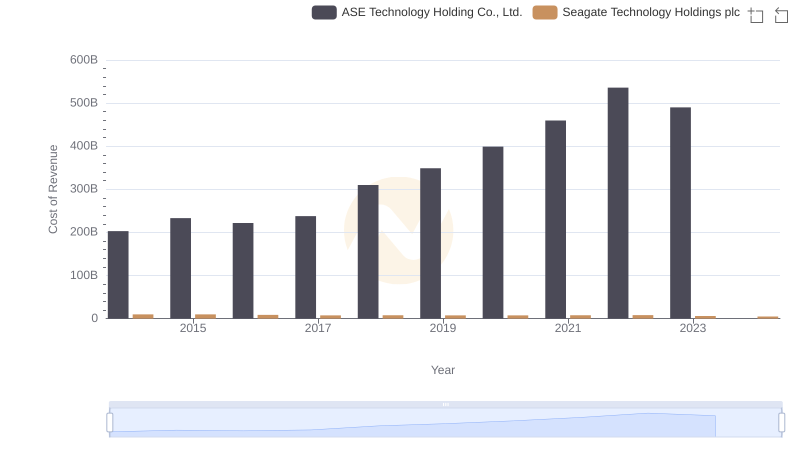
Analyzing Cost of Revenue: Seagate Technology Holdings plc and ASE Technology Holding Co., Ltd.
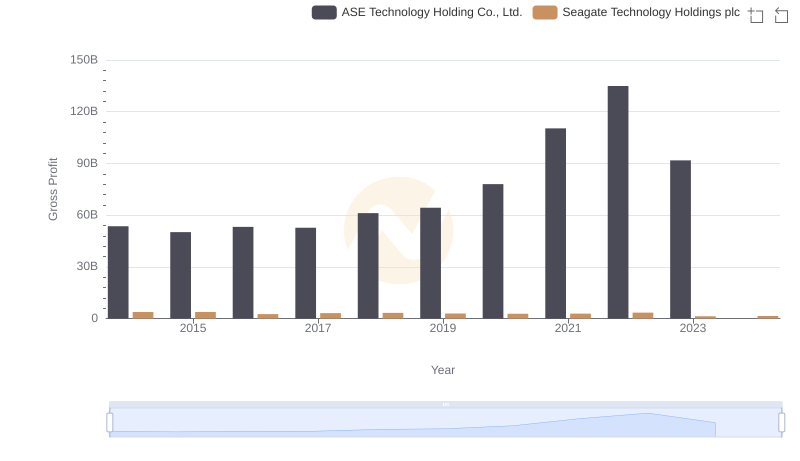
Gross Profit Trends Compared: Seagate Technology Holdings plc vs ASE Technology Holding Co., Ltd.
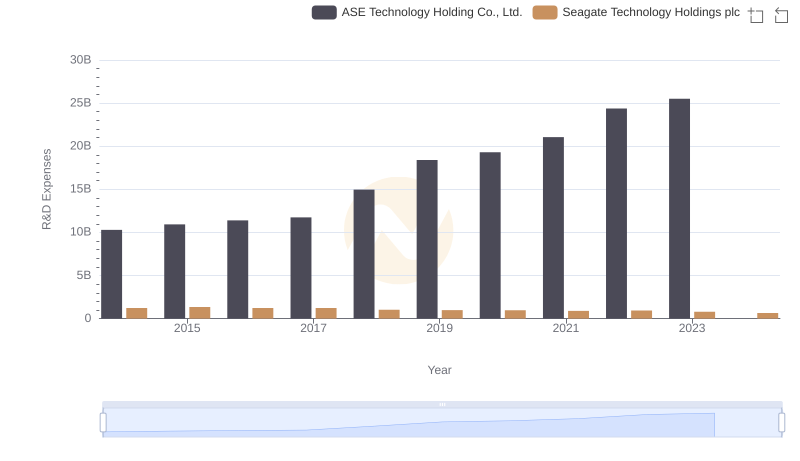
Research and Development: Comparing Key Metrics for Seagate Technology Holdings plc and ASE Technology Holding Co., Ltd.
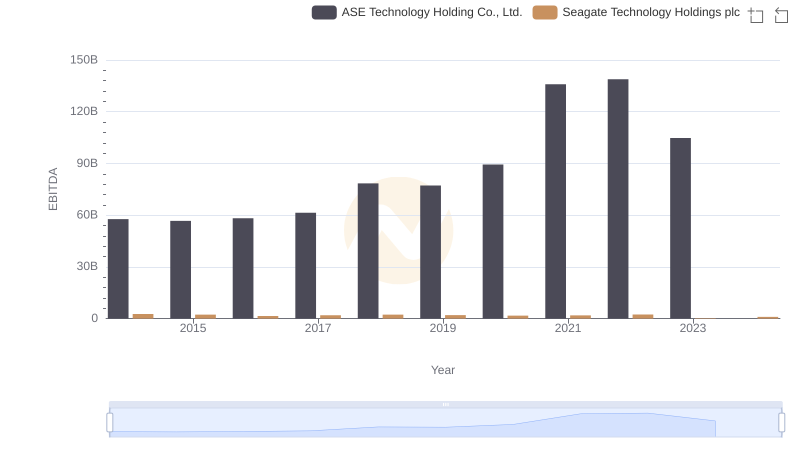
Seagate Technology Holdings plc and ASE Technology Holding Co., Ltd.: A Detailed Examination of EBITDA Performance