| __timestamp | ASE Technology Holding Co., Ltd. | Seagate Technology Holdings plc |
|---|---|---|
| Wednesday, January 1, 2014 | 53540000000 | 3846000000 |
| Thursday, January 1, 2015 | 50149000000 | 3809000000 |
| Friday, January 1, 2016 | 53194000000 | 2615000000 |
| Sunday, January 1, 2017 | 52732000000 | 3174000000 |
| Monday, January 1, 2018 | 61163000000 | 3364000000 |
| Tuesday, January 1, 2019 | 64311000000 | 2932000000 |
| Wednesday, January 1, 2020 | 77984000000 | 2842000000 |
| Friday, January 1, 2021 | 110369000000 | 2917000000 |
| Saturday, January 1, 2022 | 134930000000 | 3469000000 |
| Sunday, January 1, 2023 | 91757132000 | 1351000000 |
| Monday, January 1, 2024 | 95687183000 | 1546000000 |
Infusing magic into the data realm
In the ever-evolving landscape of technology, Seagate Technology Holdings plc and ASE Technology Holding Co., Ltd. have carved distinct paths in their financial journeys. From 2014 to 2023, ASE Technology's gross profit surged by approximately 72%, peaking in 2022. This remarkable growth underscores ASE's strategic prowess in the semiconductor industry. In contrast, Seagate's gross profit exhibited a more modest trajectory, with a notable dip in 2023, reflecting the challenges faced in the data storage sector.
ASE's gross profit in 2022 was nearly 40 times that of Seagate, highlighting the divergent scales of their operations. However, Seagate's resilience is evident in its ability to maintain a steady gross profit despite market fluctuations. As we look to the future, the absence of data for ASE in 2024 leaves room for speculation on its next strategic move.
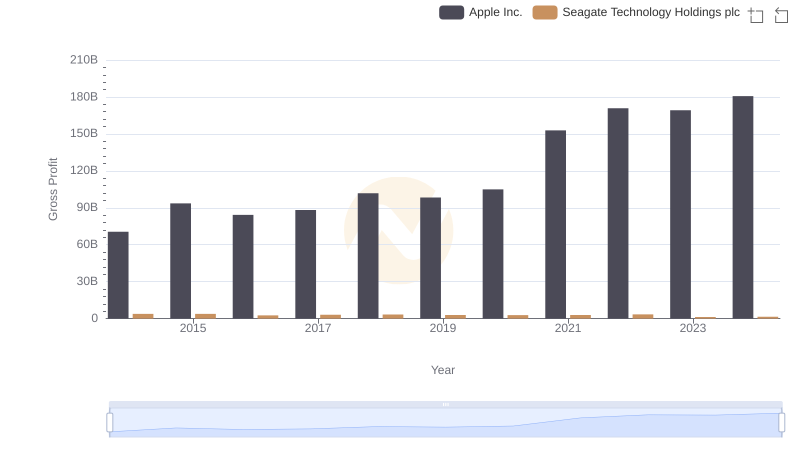
Apple Inc. vs Seagate Technology Holdings plc: A Gross Profit Performance Breakdown
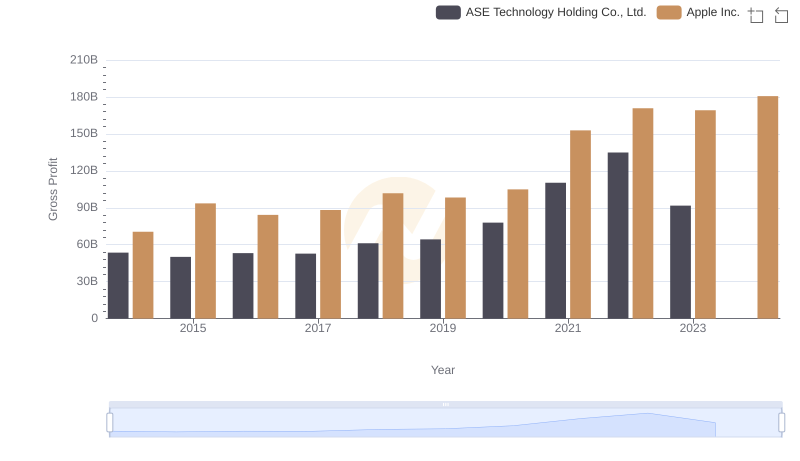
Apple Inc. vs ASE Technology Holding Co., Ltd.: A Gross Profit Performance Breakdown
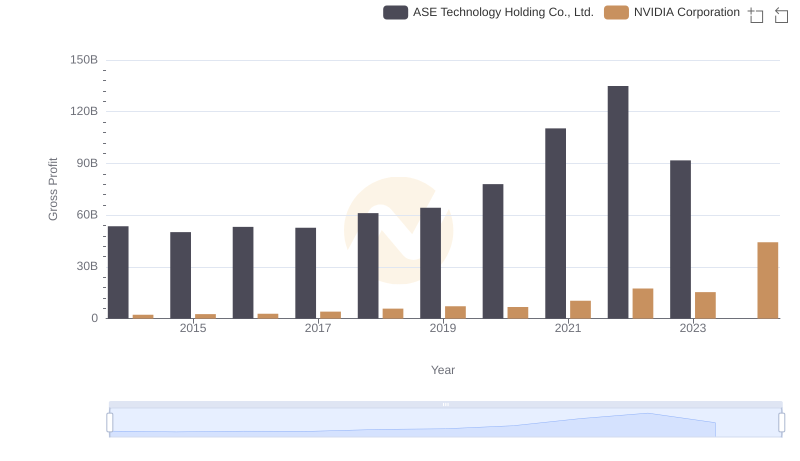
Key Insights on Gross Profit: NVIDIA Corporation vs ASE Technology Holding Co., Ltd.
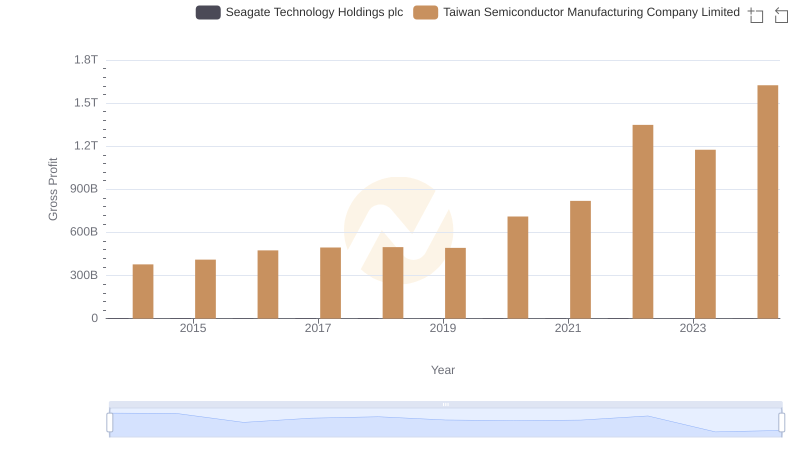
Gross Profit Trends Compared: Taiwan Semiconductor Manufacturing Company Limited vs Seagate Technology Holdings plc
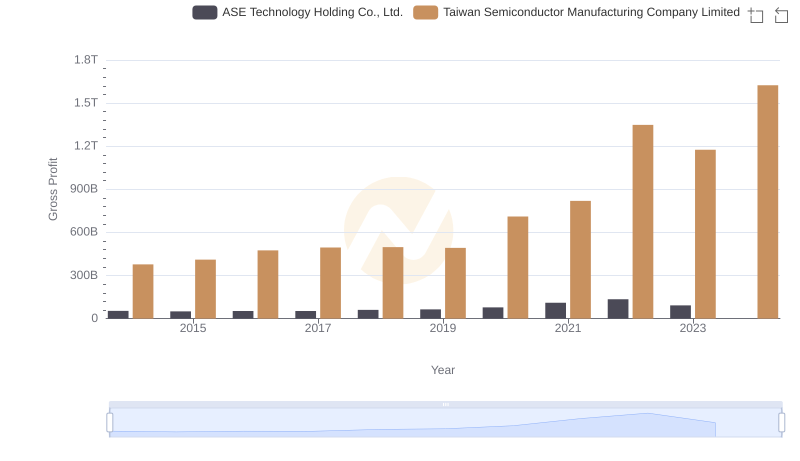
Taiwan Semiconductor Manufacturing Company Limited and ASE Technology Holding Co., Ltd.: A Detailed Gross Profit Analysis
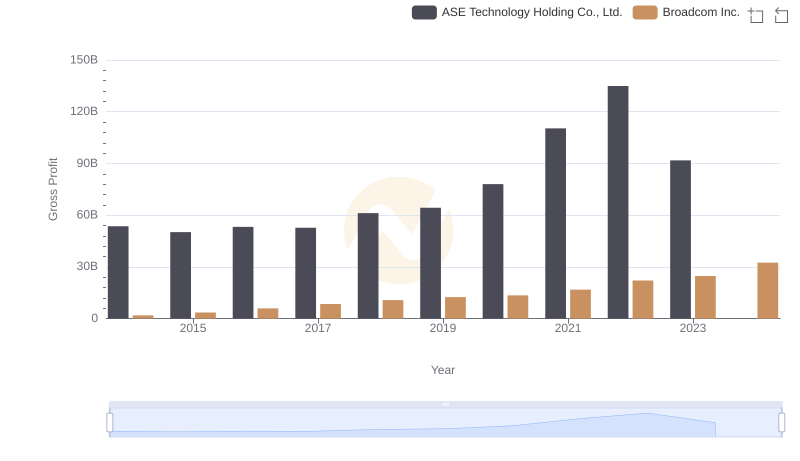
Who Generates Higher Gross Profit? Broadcom Inc. or ASE Technology Holding Co., Ltd.
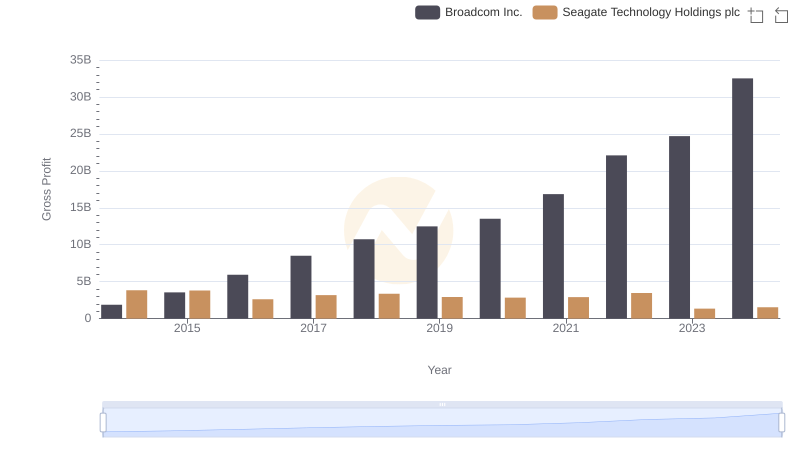
Gross Profit Trends Compared: Broadcom Inc. vs Seagate Technology Holdings plc
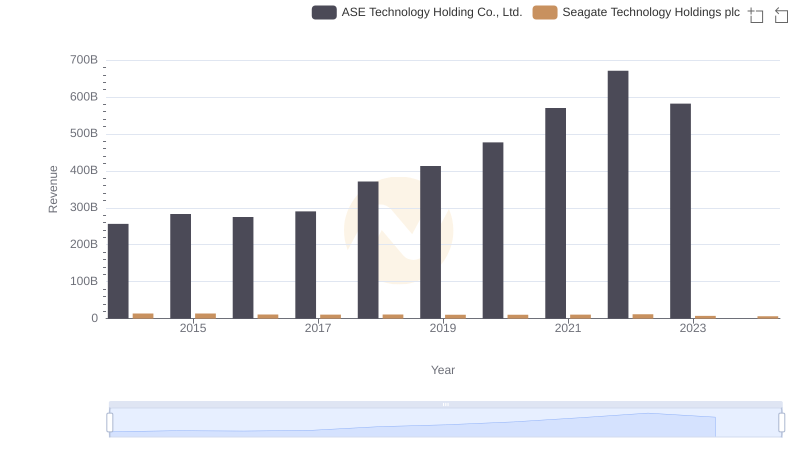
Seagate Technology Holdings plc and ASE Technology Holding Co., Ltd.: A Comprehensive Revenue Analysis
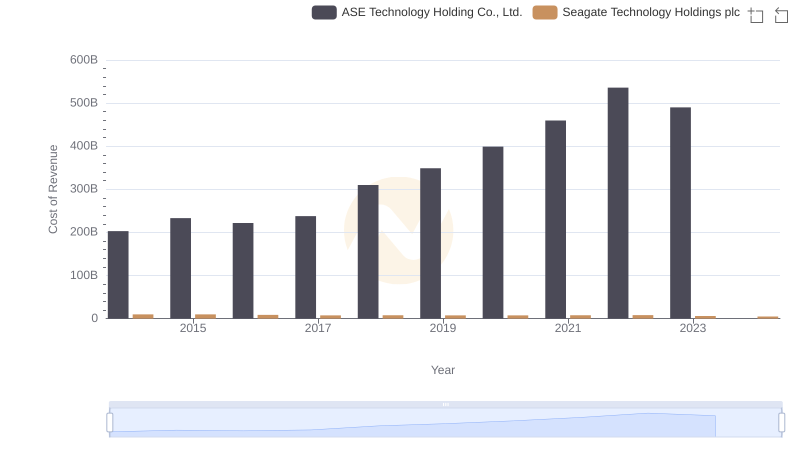
Analyzing Cost of Revenue: Seagate Technology Holdings plc and ASE Technology Holding Co., Ltd.
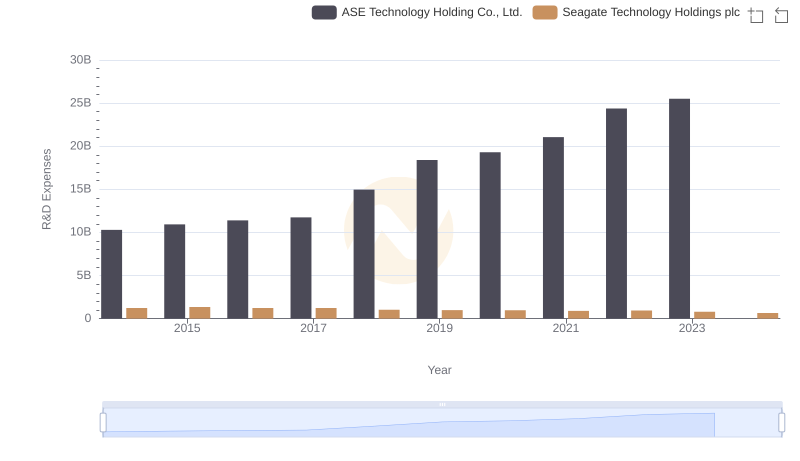
Research and Development: Comparing Key Metrics for Seagate Technology Holdings plc and ASE Technology Holding Co., Ltd.
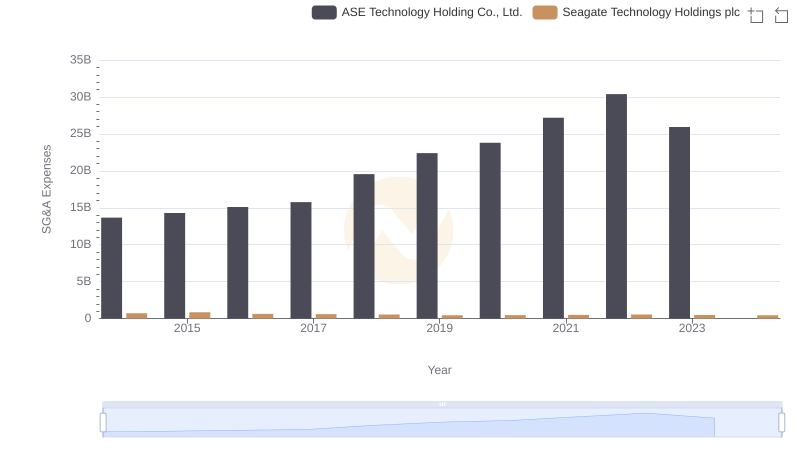
Selling, General, and Administrative Costs: Seagate Technology Holdings plc vs ASE Technology Holding Co., Ltd.
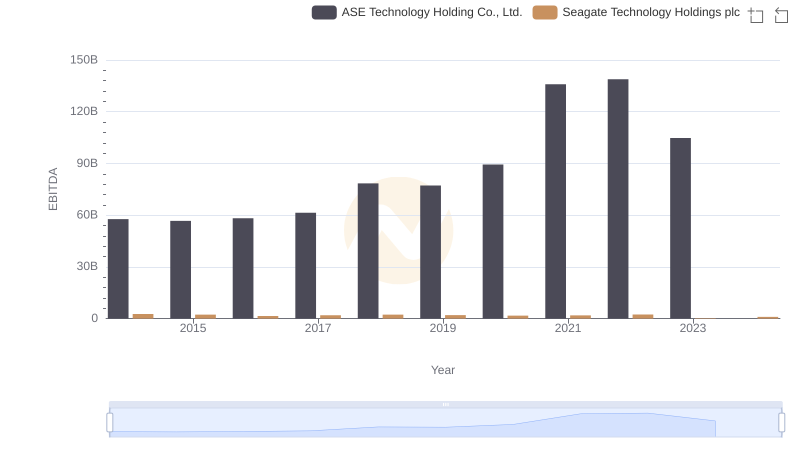
Seagate Technology Holdings plc and ASE Technology Holding Co., Ltd.: A Detailed Examination of EBITDA Performance