| __timestamp | ASE Technology Holding Co., Ltd. | Seagate Technology Holdings plc |
|---|---|---|
| Wednesday, January 1, 2014 | 256591000000 | 13724000000 |
| Thursday, January 1, 2015 | 283302000000 | 13739000000 |
| Friday, January 1, 2016 | 274884000000 | 11160000000 |
| Sunday, January 1, 2017 | 290441000000 | 10771000000 |
| Monday, January 1, 2018 | 371092000000 | 11184000000 |
| Tuesday, January 1, 2019 | 413182000000 | 10390000000 |
| Wednesday, January 1, 2020 | 476978000000 | 10509000000 |
| Friday, January 1, 2021 | 569997000000 | 10681000000 |
| Saturday, January 1, 2022 | 670873000000 | 11661000000 |
| Sunday, January 1, 2023 | 581914471000 | 7384000000 |
| Monday, January 1, 2024 | 595410063000 | 6551000000 |
Data in motion
In the ever-evolving tech industry, revenue growth is a key indicator of a company's success. Over the past decade, ASE Technology Holding Co., Ltd. has demonstrated a remarkable upward trajectory, with its revenue increasing by approximately 127% from 2014 to 2022. In contrast, Seagate Technology Holdings plc experienced a more modest growth of around 15% during the same period. Notably, ASE's revenue peaked in 2022, while Seagate's highest revenue was recorded in 2015. However, 2023 saw a decline for both companies, with Seagate's revenue dropping by 37% compared to the previous year. This data highlights the dynamic nature of the tech sector, where companies must continuously innovate to maintain their competitive edge. The missing data for 2024 suggests an opportunity for these companies to strategize and potentially reverse the downward trend.
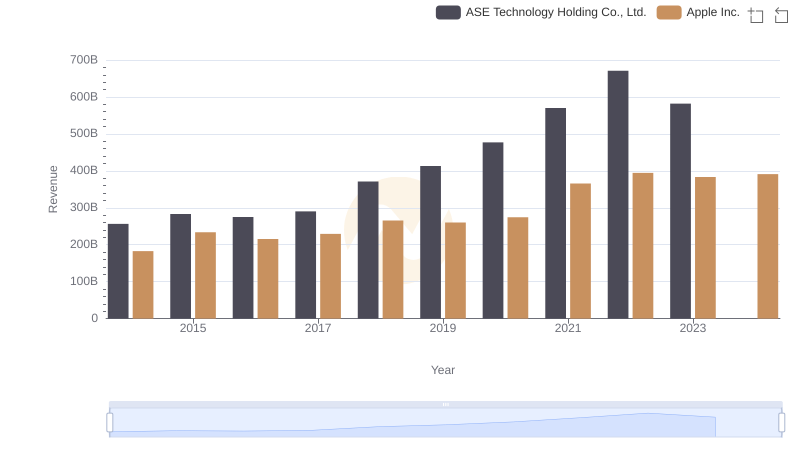
Apple Inc. or ASE Technology Holding Co., Ltd.: Who Leads in Yearly Revenue?
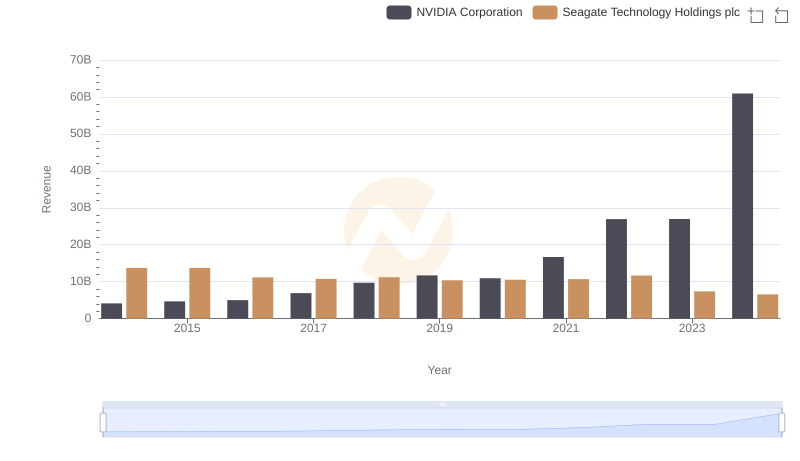
Comparing Revenue Performance: NVIDIA Corporation or Seagate Technology Holdings plc?
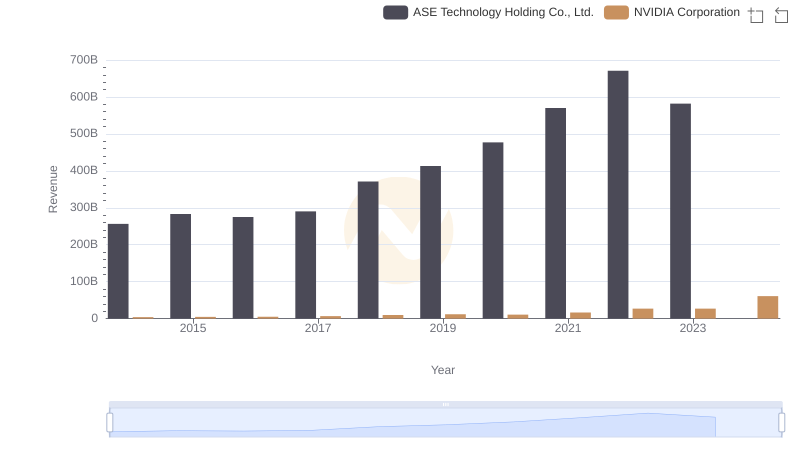
NVIDIA Corporation vs ASE Technology Holding Co., Ltd.: Annual Revenue Growth Compared
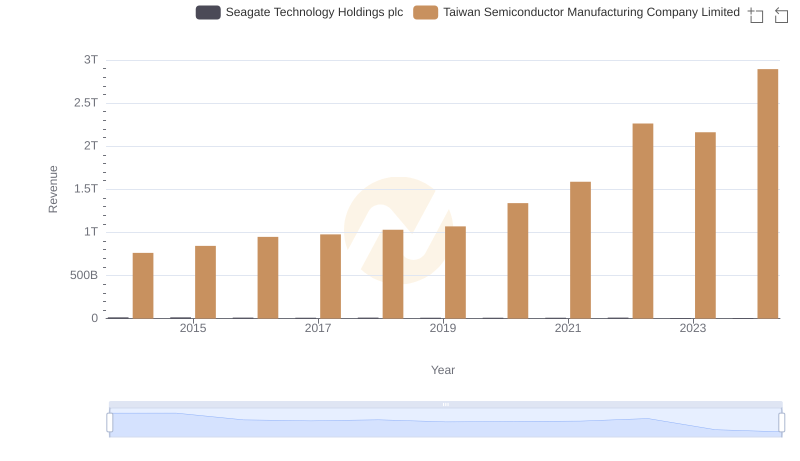
Revenue Insights: Taiwan Semiconductor Manufacturing Company Limited and Seagate Technology Holdings plc Performance Compared
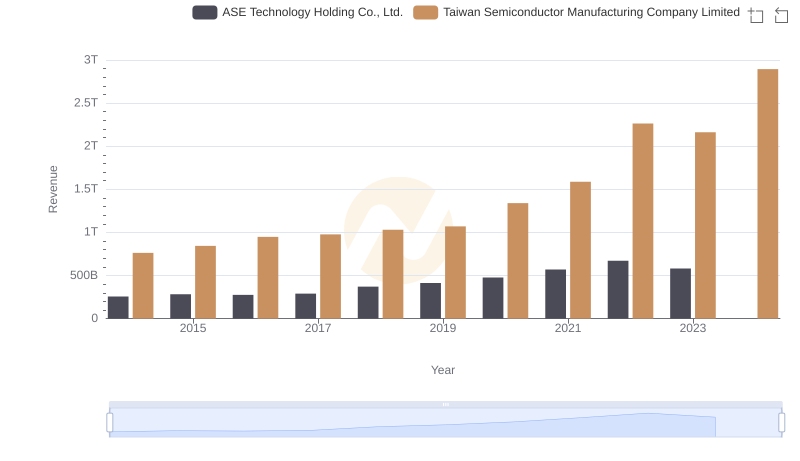
Taiwan Semiconductor Manufacturing Company Limited or ASE Technology Holding Co., Ltd.: Who Leads in Yearly Revenue?
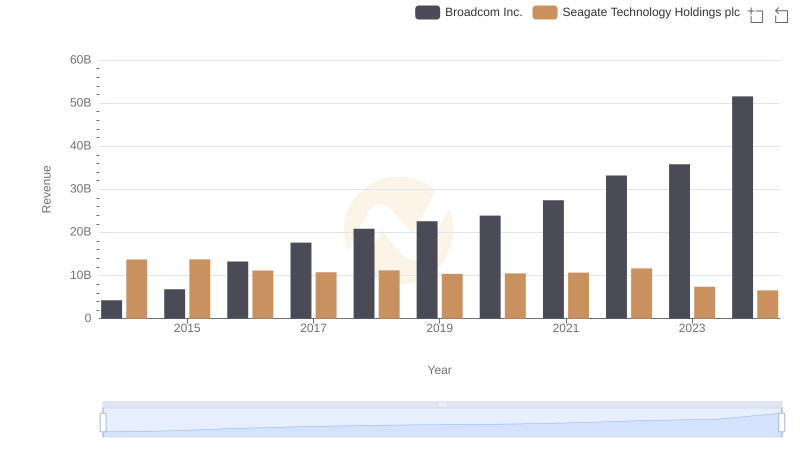
Comparing Revenue Performance: Broadcom Inc. or Seagate Technology Holdings plc?
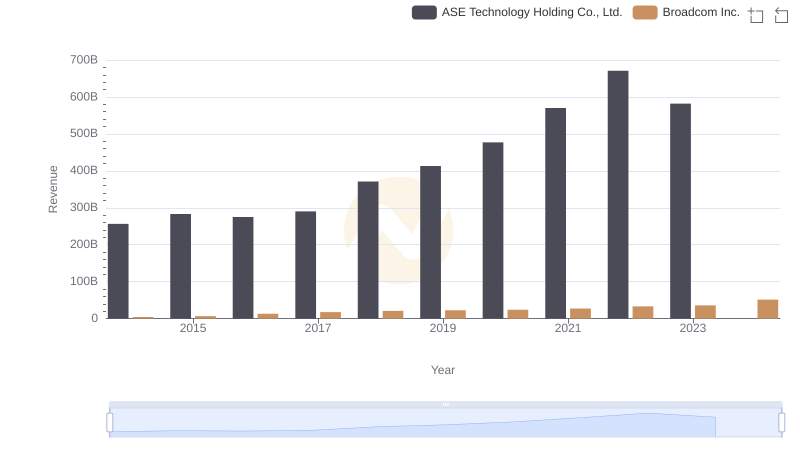
Broadcom Inc. and ASE Technology Holding Co., Ltd.: A Comprehensive Revenue Analysis
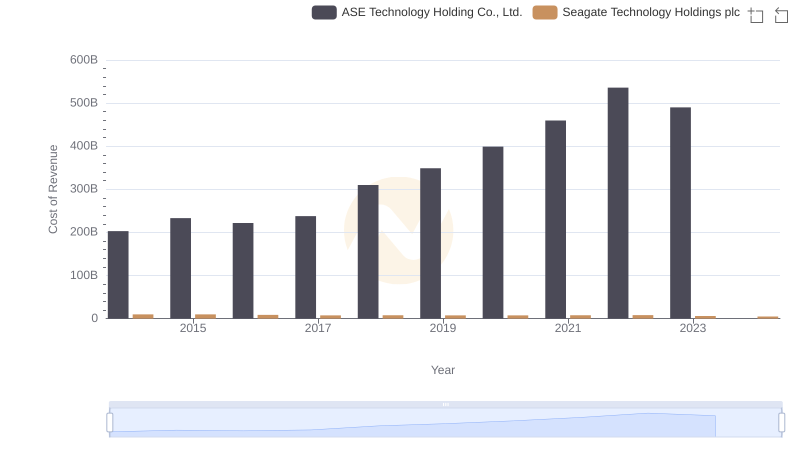
Analyzing Cost of Revenue: Seagate Technology Holdings plc and ASE Technology Holding Co., Ltd.
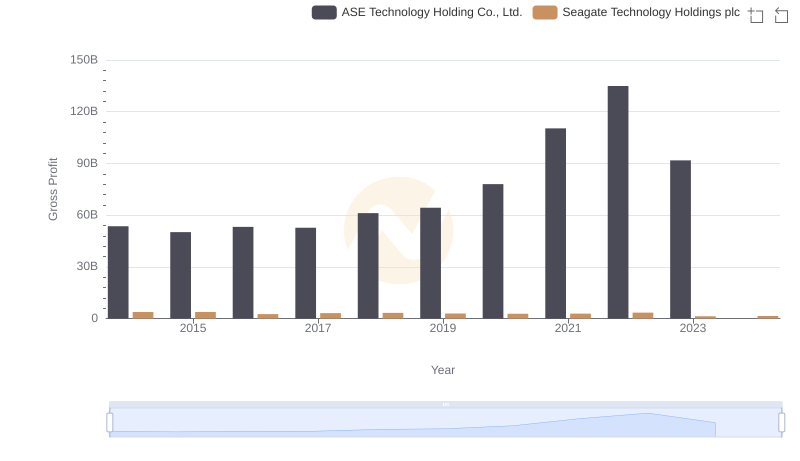
Gross Profit Trends Compared: Seagate Technology Holdings plc vs ASE Technology Holding Co., Ltd.
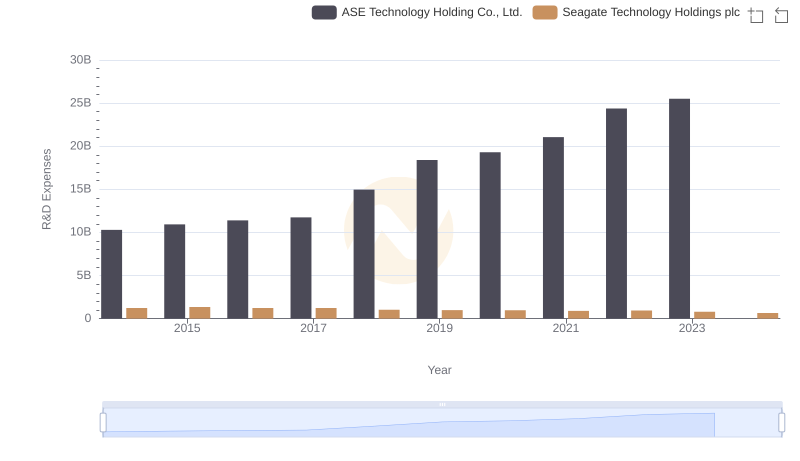
Research and Development: Comparing Key Metrics for Seagate Technology Holdings plc and ASE Technology Holding Co., Ltd.
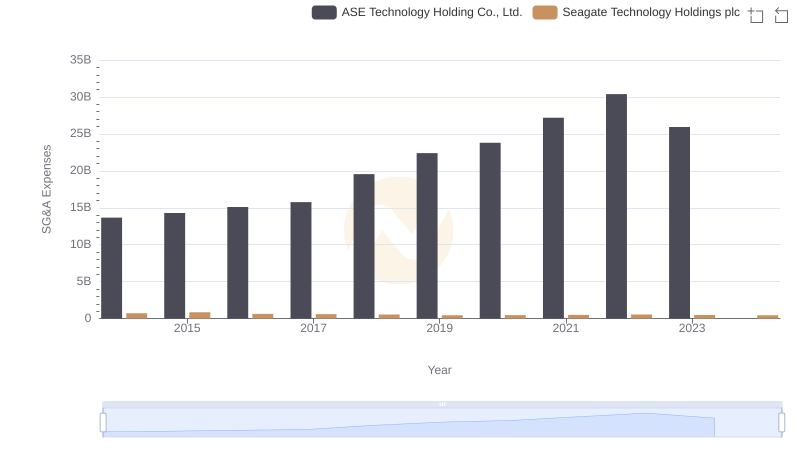
Selling, General, and Administrative Costs: Seagate Technology Holdings plc vs ASE Technology Holding Co., Ltd.
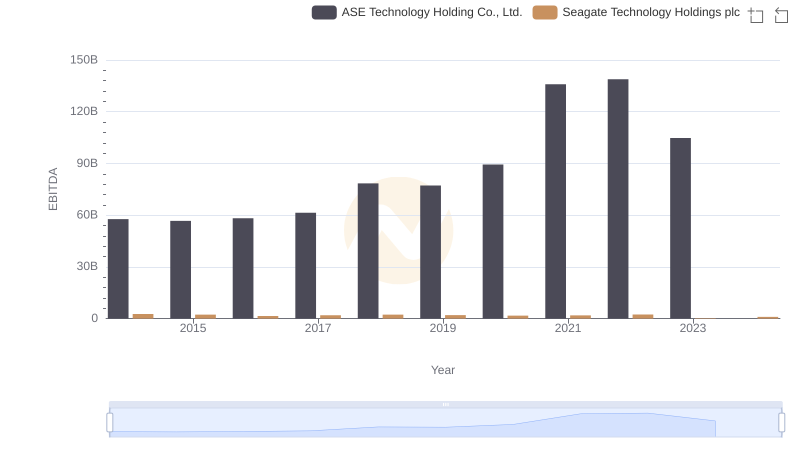
Seagate Technology Holdings plc and ASE Technology Holding Co., Ltd.: A Detailed Examination of EBITDA Performance