| __timestamp | ASE Technology Holding Co., Ltd. | Seagate Technology Holdings plc |
|---|---|---|
| Wednesday, January 1, 2014 | 57728376000 | 2665000000 |
| Thursday, January 1, 2015 | 56716330000 | 2312000000 |
| Friday, January 1, 2016 | 58196307000 | 1488000000 |
| Sunday, January 1, 2017 | 61377328000 | 1981000000 |
| Monday, January 1, 2018 | 78432873000 | 2328000000 |
| Tuesday, January 1, 2019 | 77173662000 | 2006000000 |
| Wednesday, January 1, 2020 | 89377502000 | 1761000000 |
| Friday, January 1, 2021 | 135966088000 | 1897000000 |
| Saturday, January 1, 2022 | 138852591000 | 2409000000 |
| Sunday, January 1, 2023 | 104757657000 | 301000000 |
| Monday, January 1, 2024 | 104735170000 | 1030000000 |
Igniting the spark of knowledge
In the ever-evolving landscape of technology, Seagate Technology Holdings plc and ASE Technology Holding Co., Ltd. have carved distinct paths in their EBITDA performance over the past decade. From 2014 to 2023, ASE Technology's EBITDA soared by approximately 82%, peaking in 2022, while Seagate experienced a more modest fluctuation, with a notable dip in 2023.
ASE Technology's EBITDA growth is a testament to its robust operational strategies, with a remarkable increase from 2014 to 2022. Despite a slight decline in 2023, the company maintained a strong financial position, reflecting its resilience in the semiconductor industry.
Seagate, on the other hand, faced a challenging landscape, with EBITDA peaking in 2014 and experiencing a significant drop by 2023. This trend highlights the competitive pressures in the data storage sector.
Both companies showcase the dynamic nature of the tech industry, where strategic adaptability is key to sustaining growth.
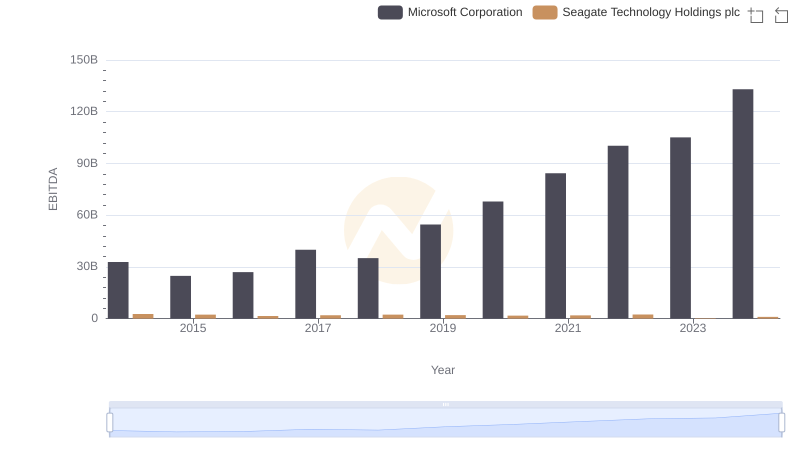
EBITDA Metrics Evaluated: Microsoft Corporation vs Seagate Technology Holdings plc
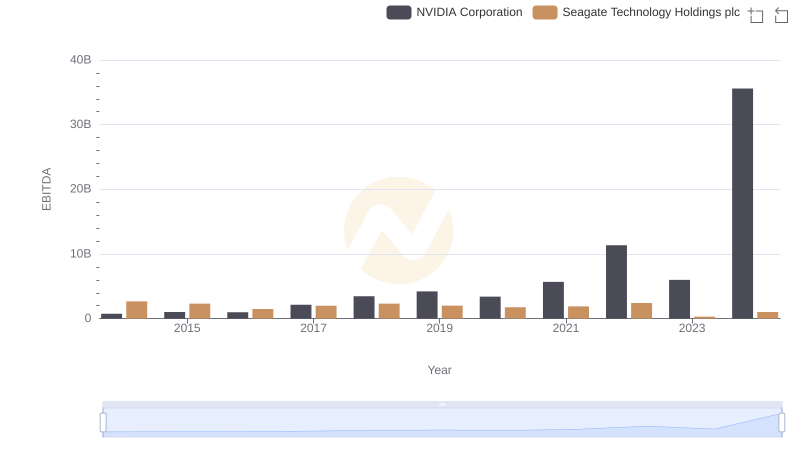
A Side-by-Side Analysis of EBITDA: NVIDIA Corporation and Seagate Technology Holdings plc
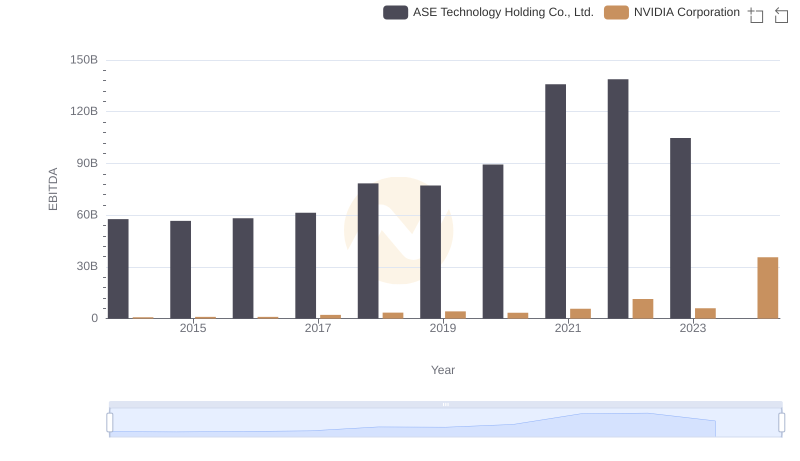
Comparative EBITDA Analysis: NVIDIA Corporation vs ASE Technology Holding Co., Ltd.
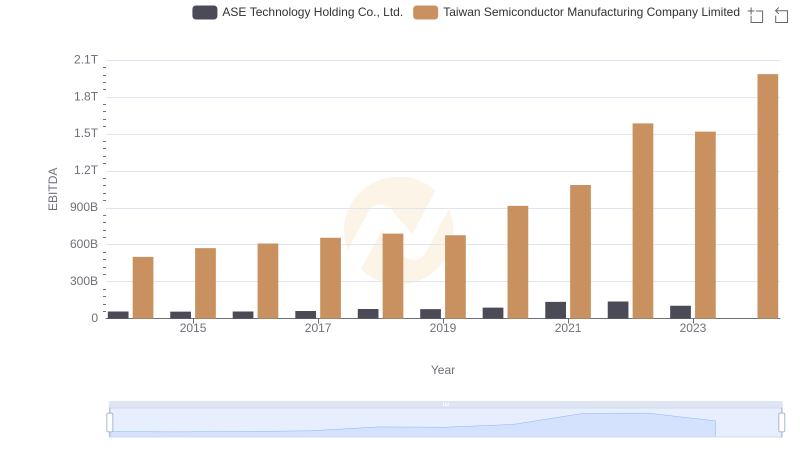
EBITDA Performance Review: Taiwan Semiconductor Manufacturing Company Limited vs ASE Technology Holding Co., Ltd.
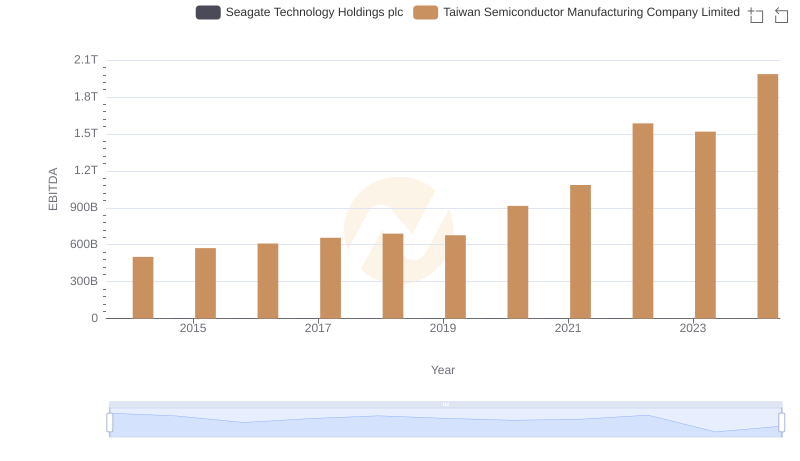
A Side-by-Side Analysis of EBITDA: Taiwan Semiconductor Manufacturing Company Limited and Seagate Technology Holdings plc
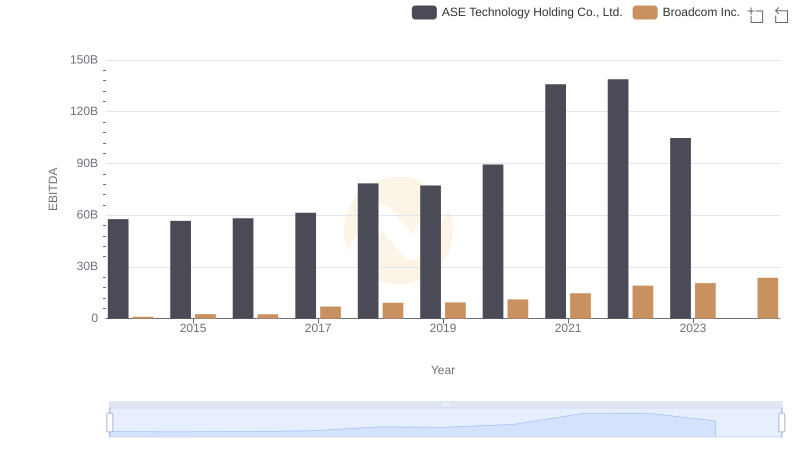
Professional EBITDA Benchmarking: Broadcom Inc. vs ASE Technology Holding Co., Ltd.
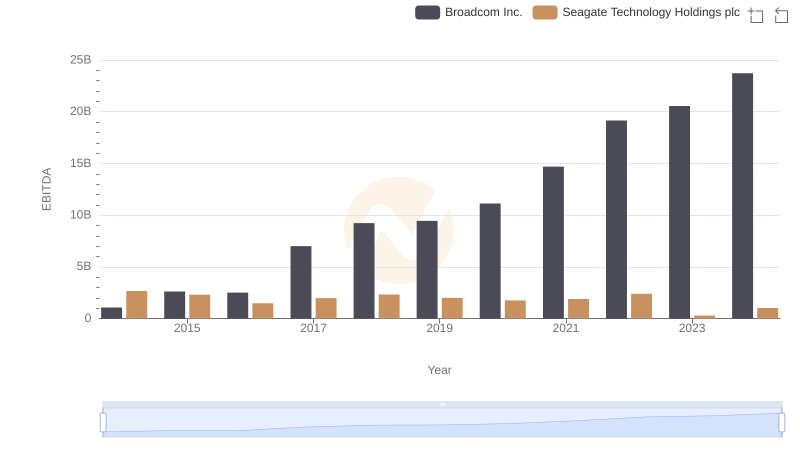
Comparative EBITDA Analysis: Broadcom Inc. vs Seagate Technology Holdings plc
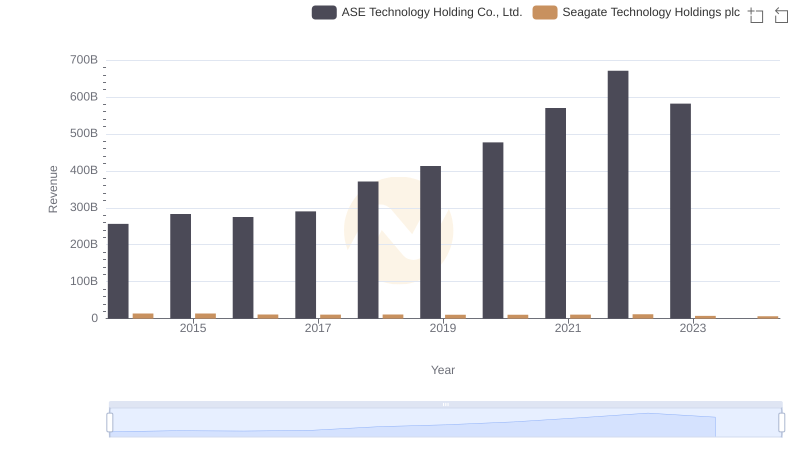
Seagate Technology Holdings plc and ASE Technology Holding Co., Ltd.: A Comprehensive Revenue Analysis
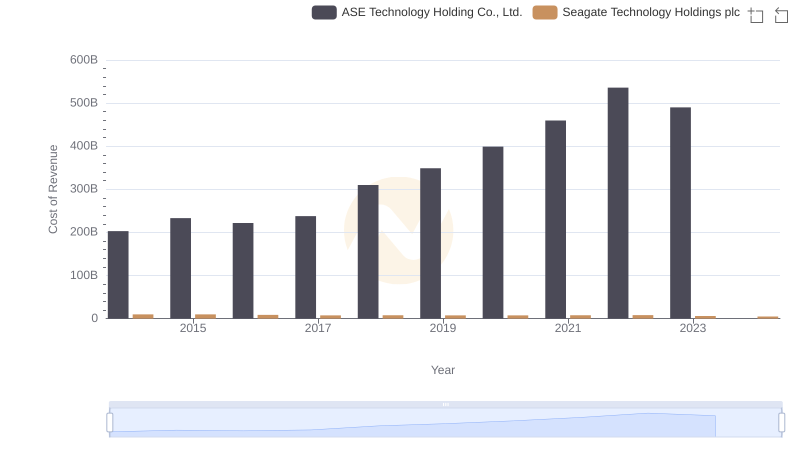
Analyzing Cost of Revenue: Seagate Technology Holdings plc and ASE Technology Holding Co., Ltd.
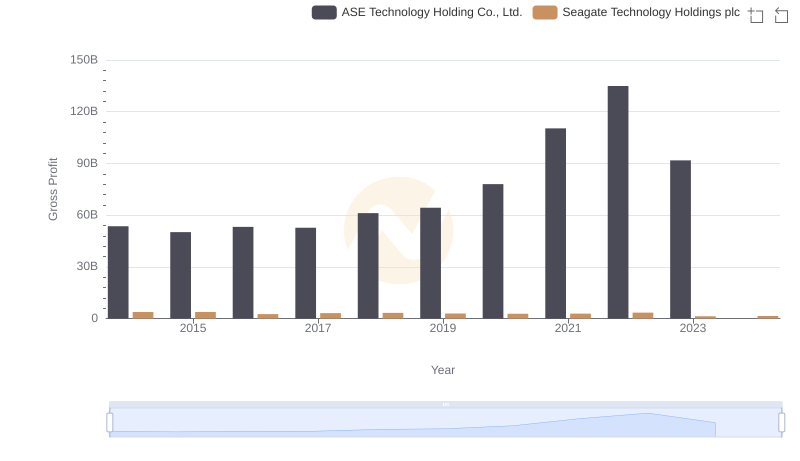
Gross Profit Trends Compared: Seagate Technology Holdings plc vs ASE Technology Holding Co., Ltd.
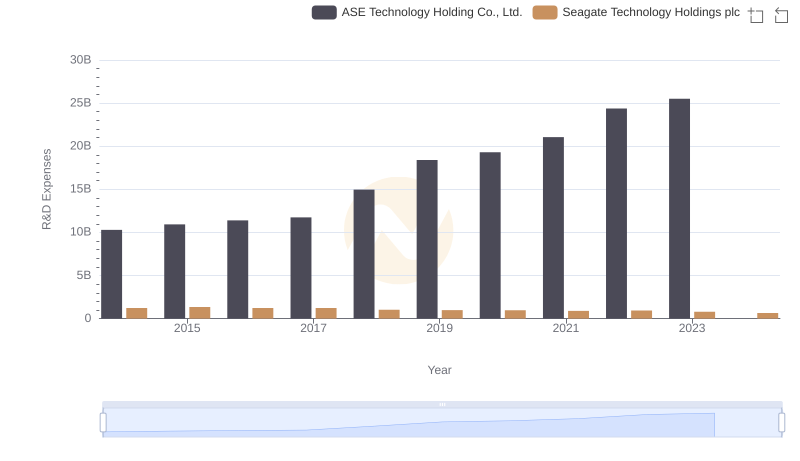
Research and Development: Comparing Key Metrics for Seagate Technology Holdings plc and ASE Technology Holding Co., Ltd.
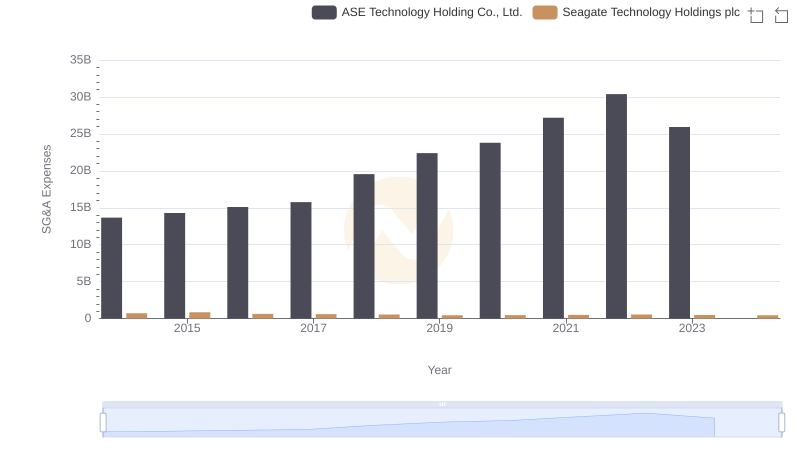
Selling, General, and Administrative Costs: Seagate Technology Holdings plc vs ASE Technology Holding Co., Ltd.