| __timestamp | Global Payments Inc. | Rockwell Automation, Inc. |
|---|---|---|
| Wednesday, January 1, 2014 | 2773718000 | 6623500000 |
| Thursday, January 1, 2015 | 2898150000 | 6307900000 |
| Friday, January 1, 2016 | 3370976000 | 5879500000 |
| Sunday, January 1, 2017 | 3975163000 | 6311300000 |
| Monday, January 1, 2018 | 3366366000 | 6666000000 |
| Tuesday, January 1, 2019 | 4911892000 | 6694800000 |
| Wednesday, January 1, 2020 | 7423558000 | 6329800000 |
| Friday, January 1, 2021 | 8523762000 | 6997400000 |
| Saturday, January 1, 2022 | 8975515000 | 7760400000 |
| Sunday, January 1, 2023 | 9654419000 | 9058000000 |
| Monday, January 1, 2024 | 10105894000 | 8264200000 |
Unleashing insights
In the ever-evolving landscape of industrial automation and financial technology, Rockwell Automation, Inc. and Global Payments Inc. have showcased remarkable revenue trajectories over the past decade. From 2014 to 2023, Global Payments Inc. has seen its revenue more than triple, growing from approximately $2.8 billion to nearly $9.7 billion. This represents a staggering increase of over 240%, highlighting the company's robust expansion in the fintech sector.
Meanwhile, Rockwell Automation, a stalwart in industrial automation, has demonstrated steady growth, with its revenue climbing from around $6.6 billion in 2014 to $9.1 billion in 2023, marking a 38% increase. This growth underscores Rockwell's resilience and adaptability in a competitive market.
While both companies have shown impressive revenue gains, the data for 2024 is incomplete, leaving room for speculation on future trends. As these industry giants continue to innovate, their revenue performance will be a key indicator of their market leadership.
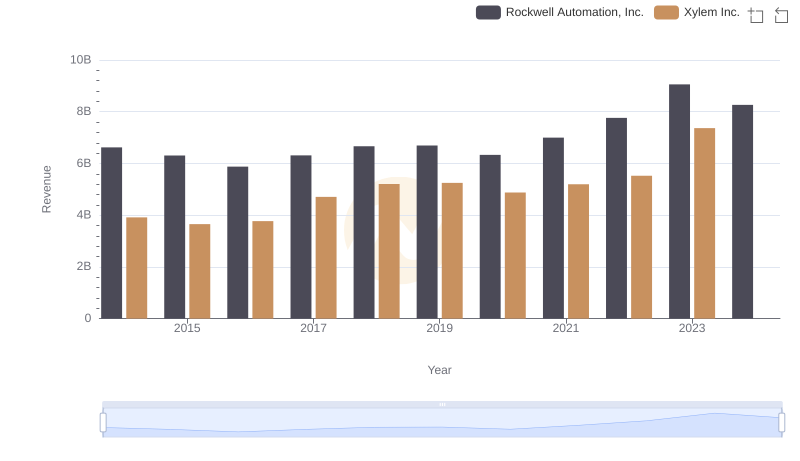
Revenue Showdown: Rockwell Automation, Inc. vs Xylem Inc.
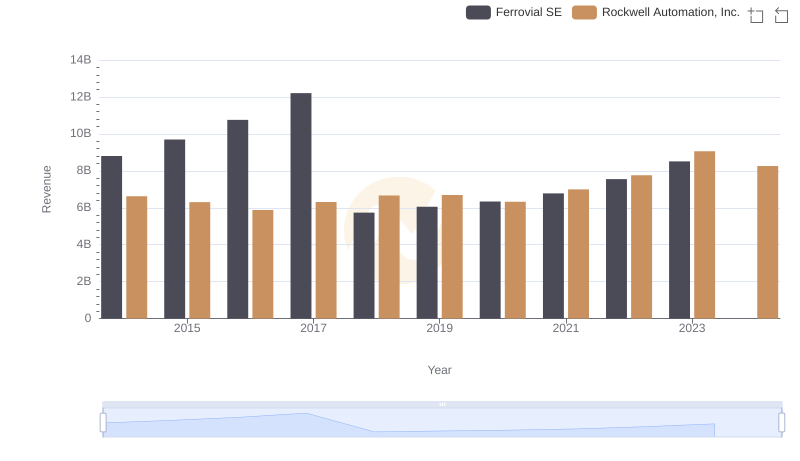
Breaking Down Revenue Trends: Rockwell Automation, Inc. vs Ferrovial SE
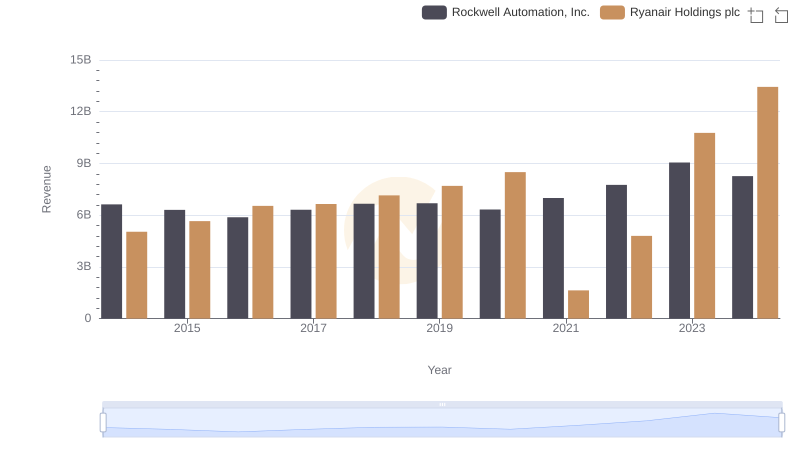
Rockwell Automation, Inc. and Ryanair Holdings plc: A Comprehensive Revenue Analysis
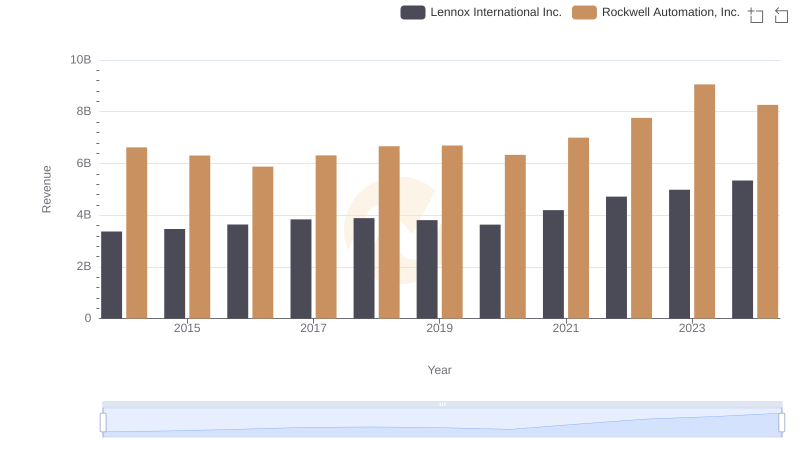
Revenue Insights: Rockwell Automation, Inc. and Lennox International Inc. Performance Compared
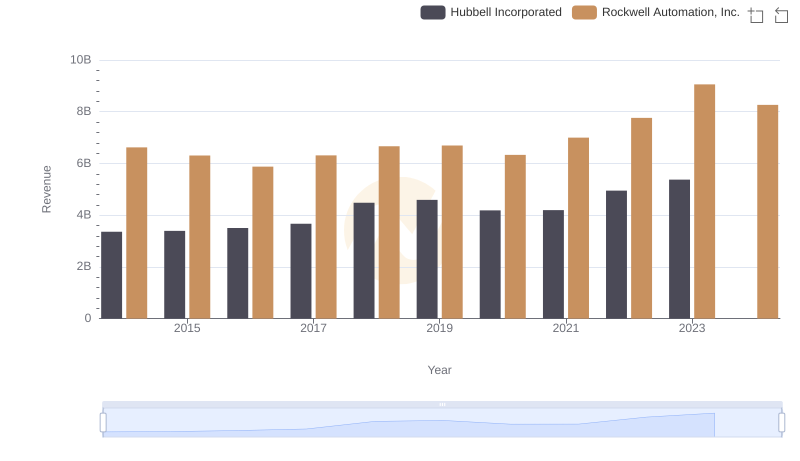
Revenue Showdown: Rockwell Automation, Inc. vs Hubbell Incorporated
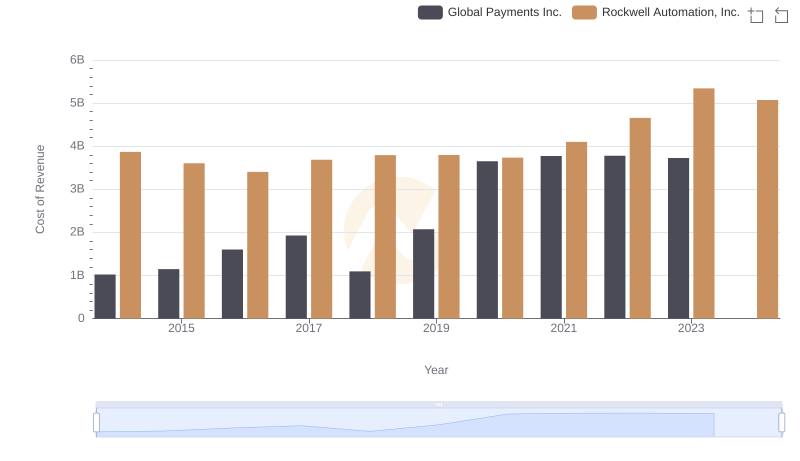
Rockwell Automation, Inc. vs Global Payments Inc.: Efficiency in Cost of Revenue Explored
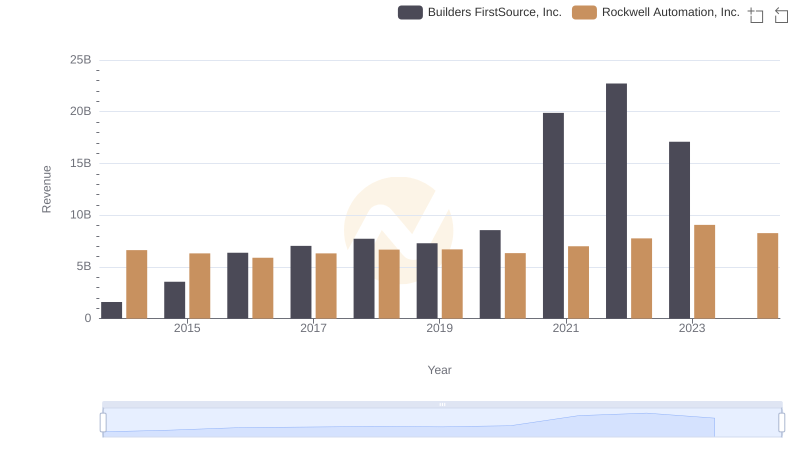
Revenue Insights: Rockwell Automation, Inc. and Builders FirstSource, Inc. Performance Compared
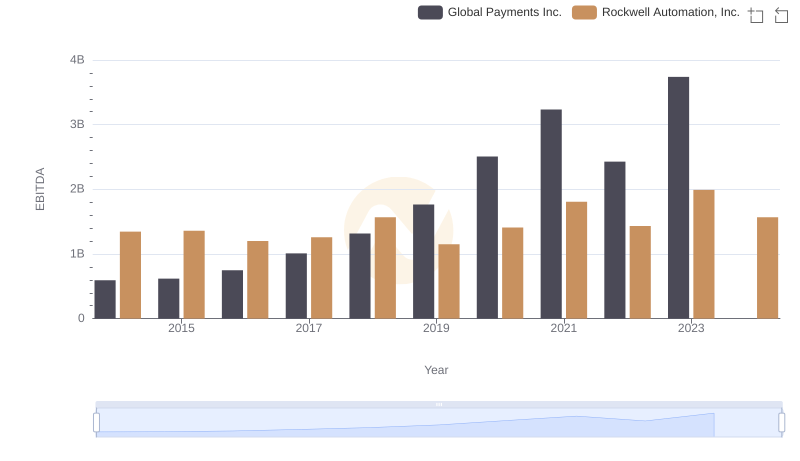
Rockwell Automation, Inc. vs Global Payments Inc.: In-Depth EBITDA Performance Comparison