| __timestamp | PTC Inc. | TE Connectivity Ltd. |
|---|---|---|
| Wednesday, January 1, 2014 | 1356967000 | 13912000000 |
| Thursday, January 1, 2015 | 1255242000 | 12233000000 |
| Friday, January 1, 2016 | 1140533000 | 12238000000 |
| Sunday, January 1, 2017 | 1164039000 | 13113000000 |
| Monday, January 1, 2018 | 1241824000 | 13988000000 |
| Tuesday, January 1, 2019 | 1255631000 | 13448000000 |
| Wednesday, January 1, 2020 | 1458415000 | 12172000000 |
| Friday, January 1, 2021 | 1807159000 | 14923000000 |
| Saturday, January 1, 2022 | 1933347000 | 16281000000 |
| Sunday, January 1, 2023 | 2097053000 | 16034000000 |
| Monday, January 1, 2024 | 2298472000 | 15845000000 |
Unveiling the hidden dimensions of data
In the competitive landscape of technology and connectivity, TE Connectivity Ltd. and PTC Inc. have been pivotal players. Over the past decade, TE Connectivity has consistently outperformed PTC Inc. in terms of revenue, showcasing its dominance in the industry. From 2014 to 2024, TE Connectivity's revenue has seen a steady increase, peaking in 2022 with a 16% rise from its 2014 figures. Meanwhile, PTC Inc. has demonstrated impressive growth, with its revenue more than doubling over the same period, reflecting a robust annual growth rate of approximately 9%.
This revenue showdown not only highlights the competitive dynamics between these two giants but also underscores the evolving trends in the tech industry.
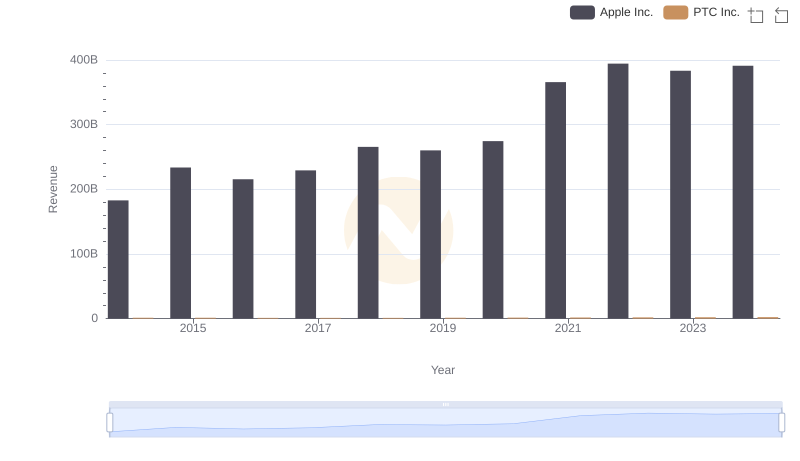
Comparing Revenue Performance: Apple Inc. or PTC Inc.?
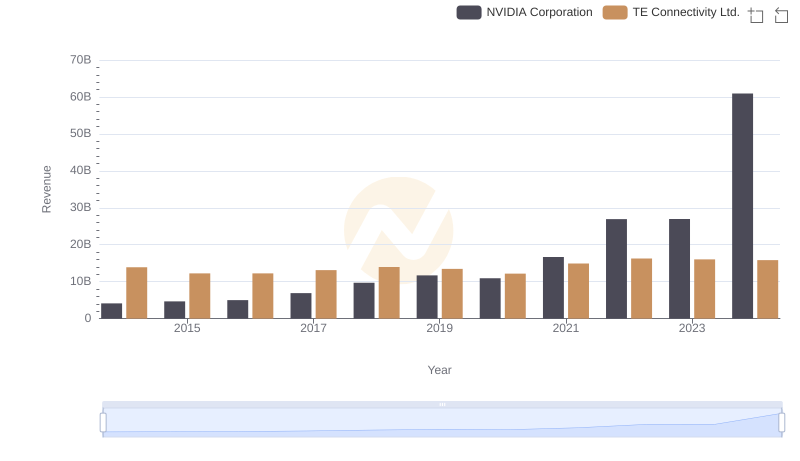
Breaking Down Revenue Trends: NVIDIA Corporation vs TE Connectivity Ltd.
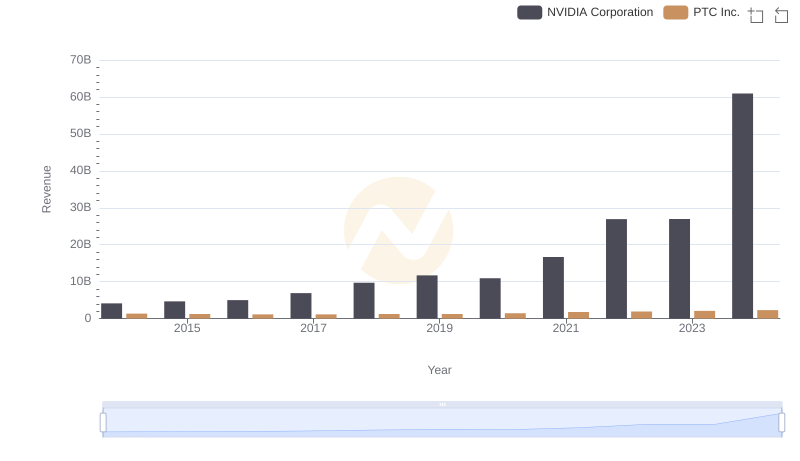
Annual Revenue Comparison: NVIDIA Corporation vs PTC Inc.
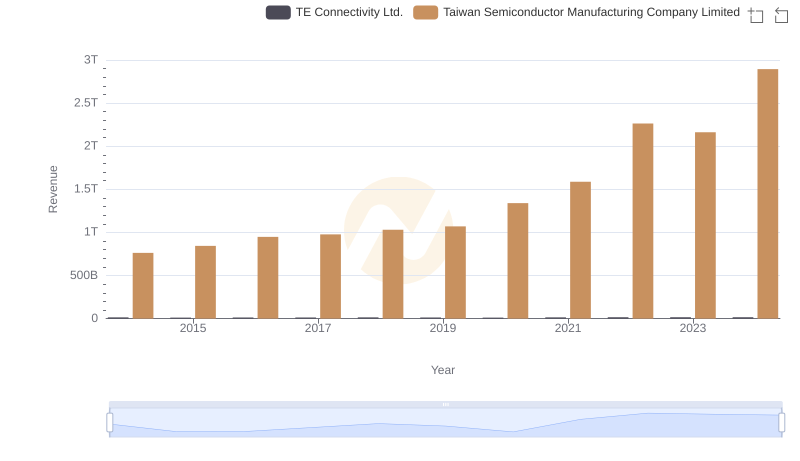
Taiwan Semiconductor Manufacturing Company Limited vs TE Connectivity Ltd.: Annual Revenue Growth Compared
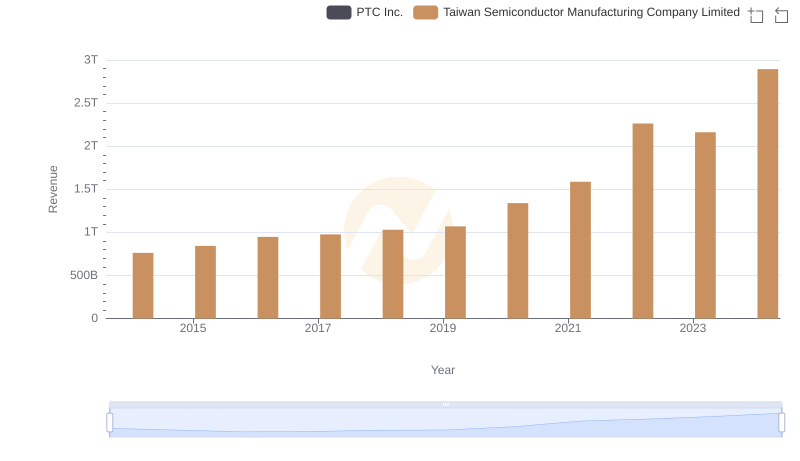
Breaking Down Revenue Trends: Taiwan Semiconductor Manufacturing Company Limited vs PTC Inc.
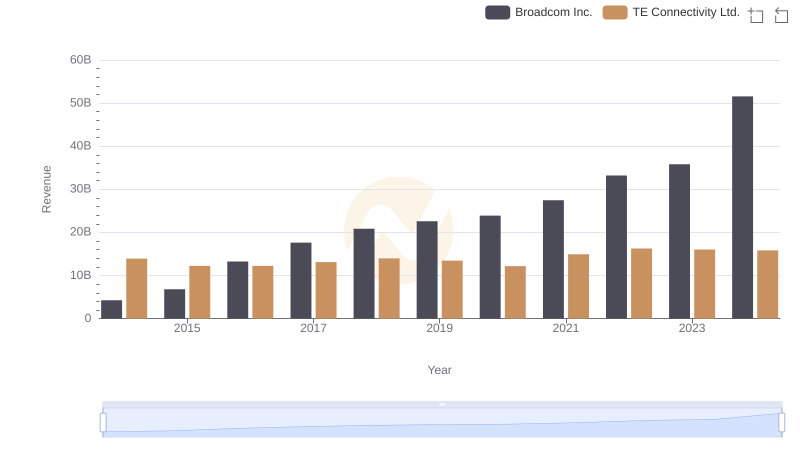
Annual Revenue Comparison: Broadcom Inc. vs TE Connectivity Ltd.
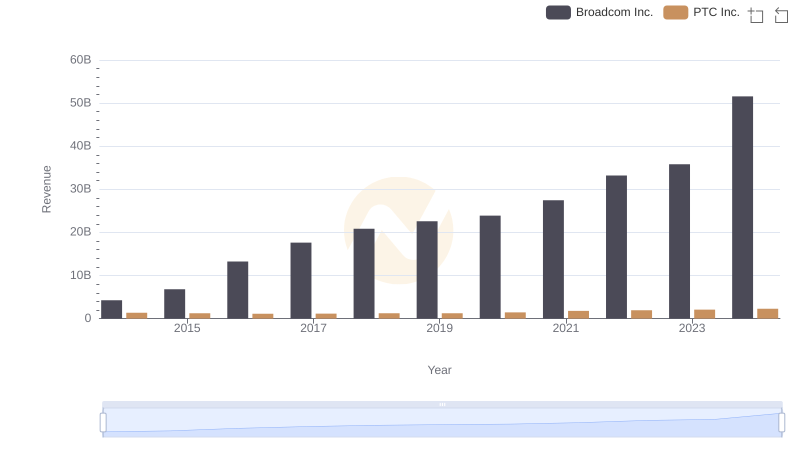
Who Generates More Revenue? Broadcom Inc. or PTC Inc.
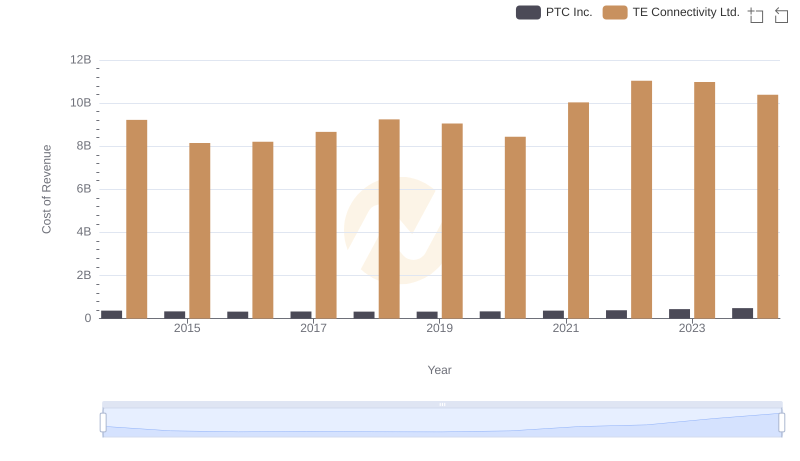
Cost of Revenue Trends: TE Connectivity Ltd. vs PTC Inc.
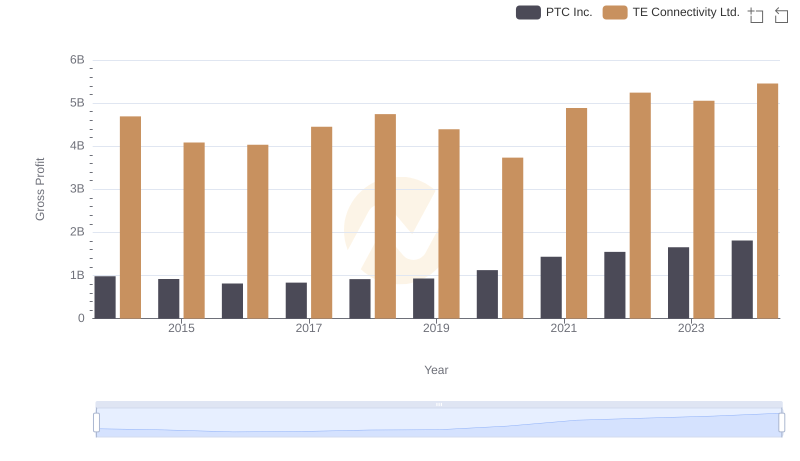
Gross Profit Comparison: TE Connectivity Ltd. and PTC Inc. Trends
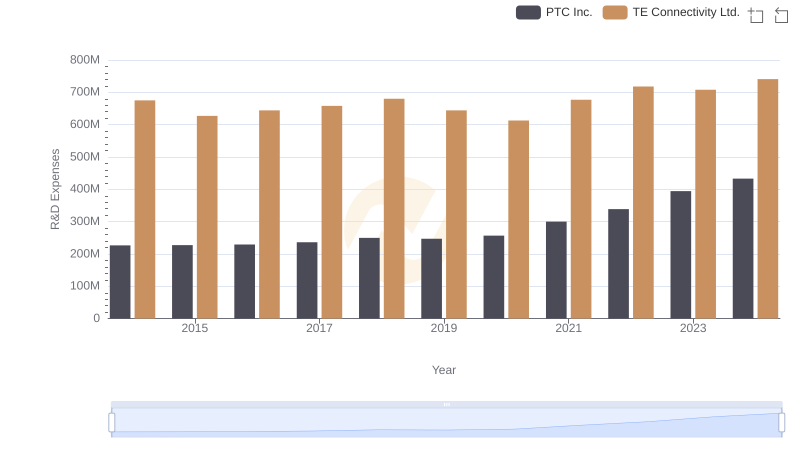
Analyzing R&D Budgets: TE Connectivity Ltd. vs PTC Inc.
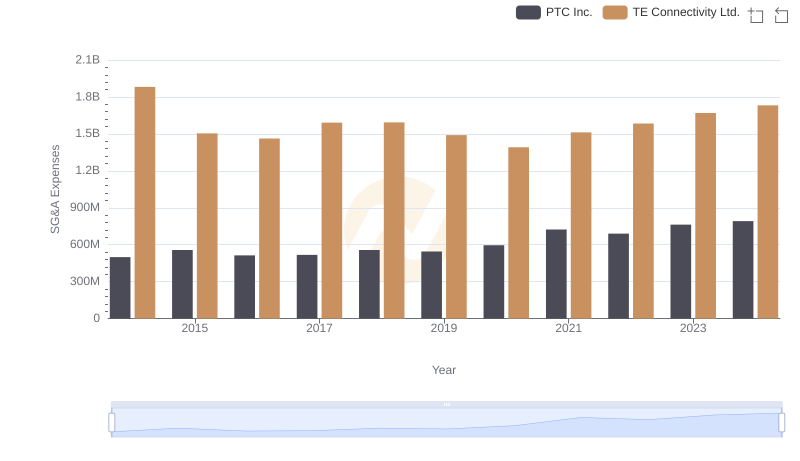
TE Connectivity Ltd. or PTC Inc.: Who Manages SG&A Costs Better?
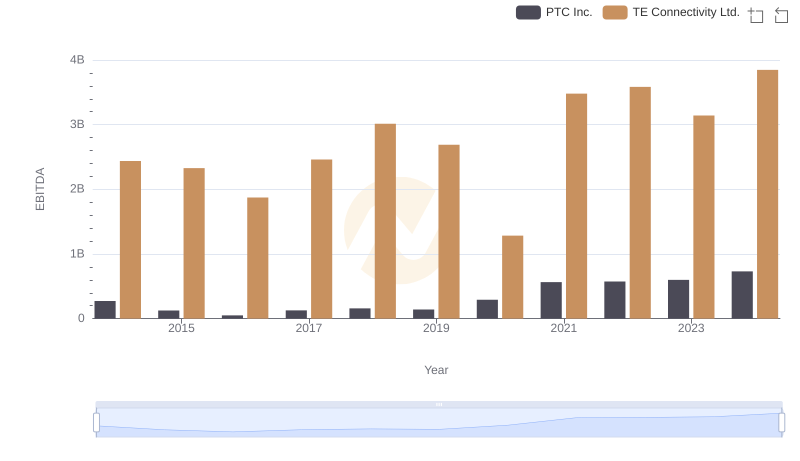
A Side-by-Side Analysis of EBITDA: TE Connectivity Ltd. and PTC Inc.