| __timestamp | PTC Inc. | TE Connectivity Ltd. |
|---|---|---|
| Wednesday, January 1, 2014 | 226496000 | 675000000 |
| Thursday, January 1, 2015 | 227513000 | 627000000 |
| Friday, January 1, 2016 | 229331000 | 644000000 |
| Sunday, January 1, 2017 | 236059000 | 658000000 |
| Monday, January 1, 2018 | 249774000 | 680000000 |
| Tuesday, January 1, 2019 | 246888000 | 644000000 |
| Wednesday, January 1, 2020 | 256575000 | 613000000 |
| Friday, January 1, 2021 | 299917000 | 677000000 |
| Saturday, January 1, 2022 | 338822000 | 718000000 |
| Sunday, January 1, 2023 | 394370000 | 708000000 |
| Monday, January 1, 2024 | 433047000 | 741000000 |
In pursuit of knowledge
In the competitive landscape of technology and connectivity, research and development (R&D) spending is a critical driver of innovation and growth. Over the past decade, TE Connectivity Ltd. and PTC Inc. have demonstrated contrasting strategies in their R&D investments. From 2014 to 2024, TE Connectivity consistently allocated a significant portion of its budget to R&D, peaking at approximately $741 million in 2024. This represents a steady increase of around 10% from 2014. Meanwhile, PTC Inc. has shown a more aggressive growth trajectory, with its R&D expenses surging by nearly 91% over the same period, reaching $433 million in 2024. This divergence highlights TE Connectivity's stable approach versus PTC's dynamic expansion strategy. As these companies continue to innovate, their R&D investments will likely play a pivotal role in shaping their future success.
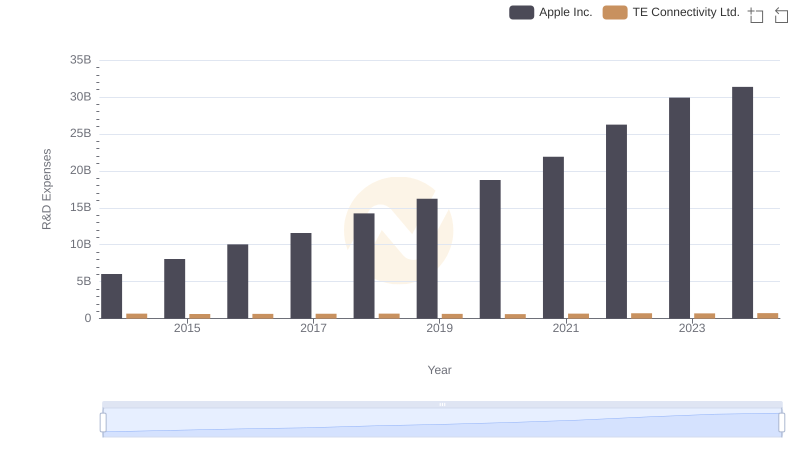
Who Prioritizes Innovation? R&D Spending Compared for Apple Inc. and TE Connectivity Ltd.
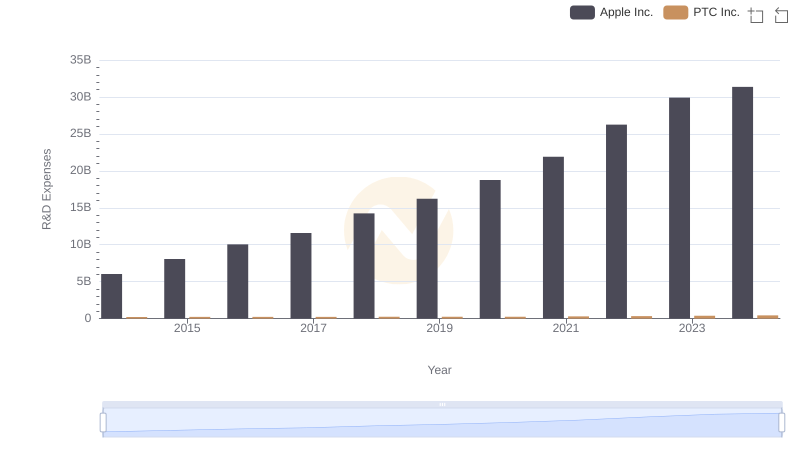
Apple Inc. or PTC Inc.: Who Invests More in Innovation?
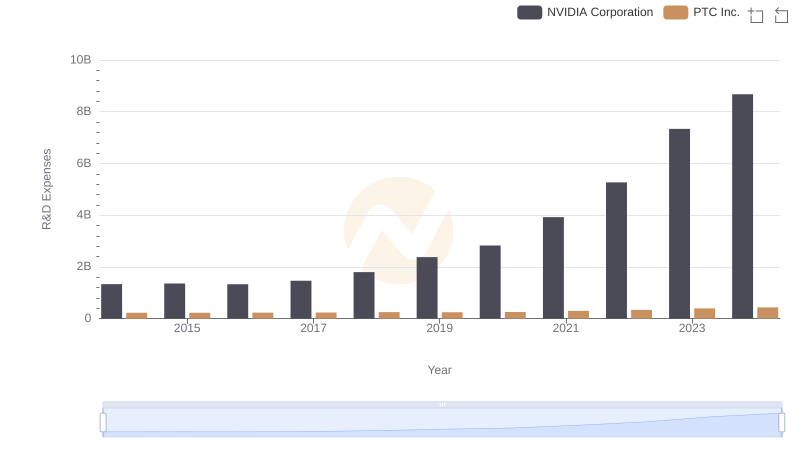
R&D Spending Showdown: NVIDIA Corporation vs PTC Inc.
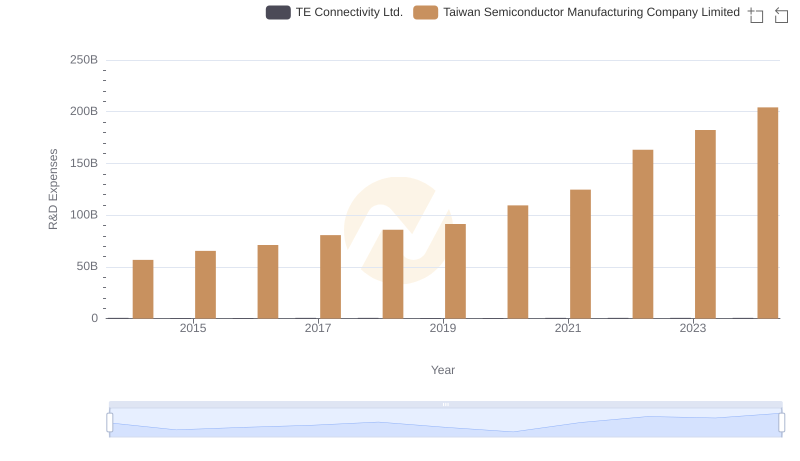
Comparing Innovation Spending: Taiwan Semiconductor Manufacturing Company Limited and TE Connectivity Ltd.
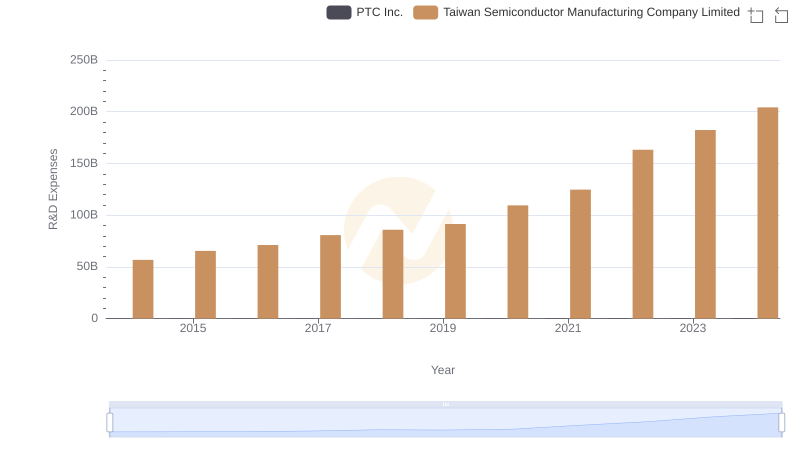
Taiwan Semiconductor Manufacturing Company Limited vs PTC Inc.: Strategic Focus on R&D Spending
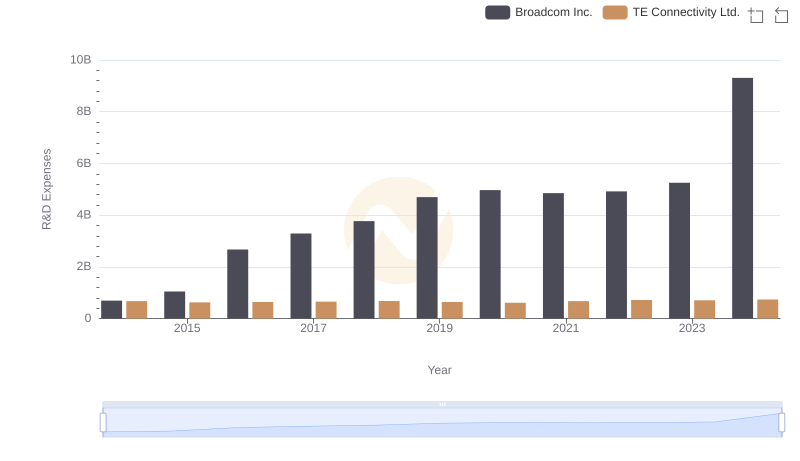
Broadcom Inc. or TE Connectivity Ltd.: Who Invests More in Innovation?
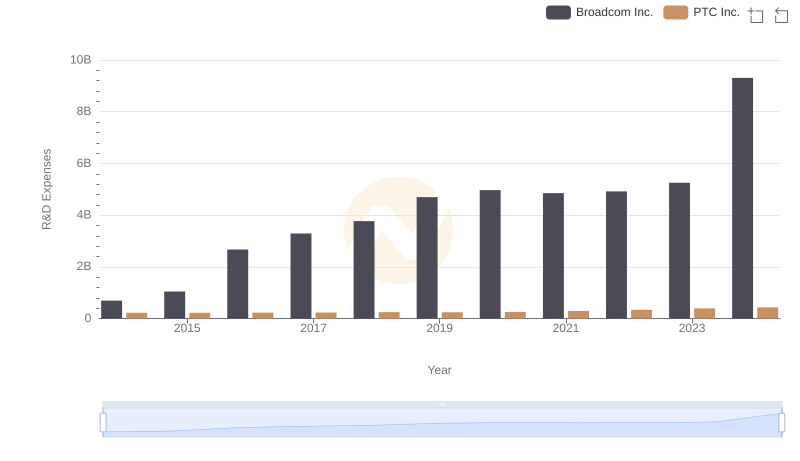
Research and Development: Comparing Key Metrics for Broadcom Inc. and PTC Inc.
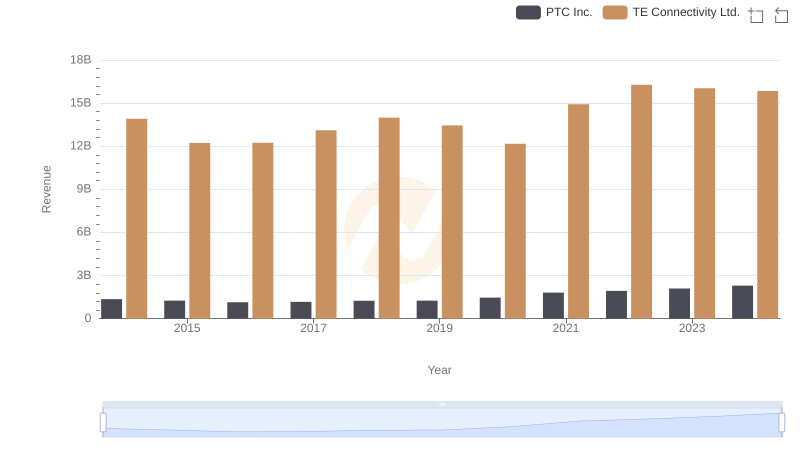
Revenue Showdown: TE Connectivity Ltd. vs PTC Inc.
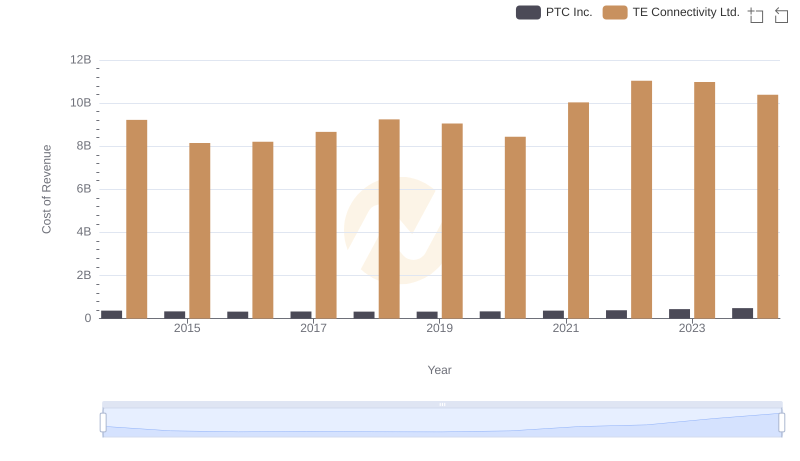
Cost of Revenue Trends: TE Connectivity Ltd. vs PTC Inc.
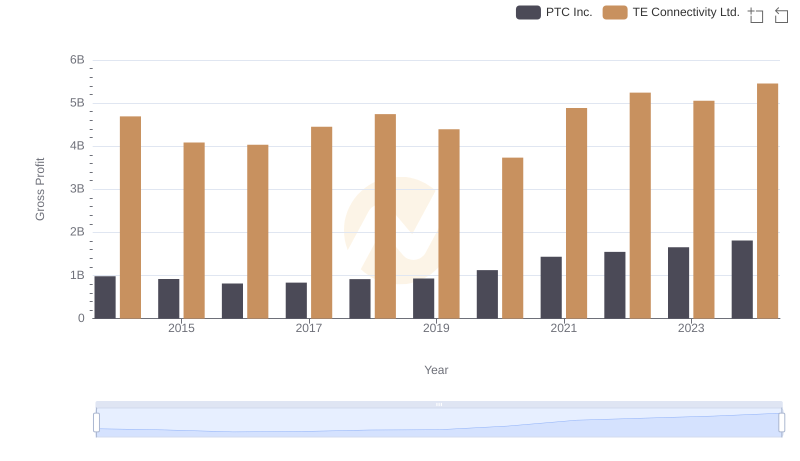
Gross Profit Comparison: TE Connectivity Ltd. and PTC Inc. Trends
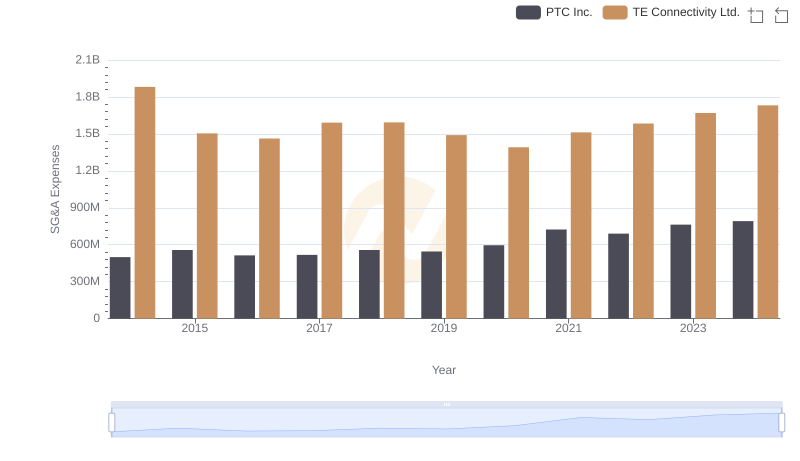
TE Connectivity Ltd. or PTC Inc.: Who Manages SG&A Costs Better?
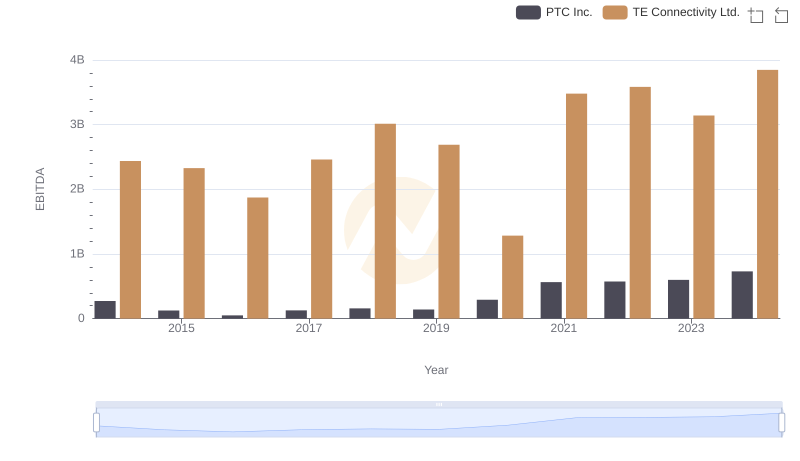
A Side-by-Side Analysis of EBITDA: TE Connectivity Ltd. and PTC Inc.