| __timestamp | PTC Inc. | TE Connectivity Ltd. |
|---|---|---|
| Wednesday, January 1, 2014 | 983284000 | 4692000000 |
| Thursday, January 1, 2015 | 920508000 | 4087000000 |
| Friday, January 1, 2016 | 814868000 | 4033000000 |
| Sunday, January 1, 2017 | 835020000 | 4450000000 |
| Monday, January 1, 2018 | 915630000 | 4745000000 |
| Tuesday, January 1, 2019 | 930253000 | 4394000000 |
| Wednesday, January 1, 2020 | 1124144000 | 3735000000 |
| Friday, January 1, 2021 | 1436057000 | 4887000000 |
| Saturday, January 1, 2022 | 1547367000 | 5244000000 |
| Sunday, January 1, 2023 | 1656047000 | 5055000000 |
| Monday, January 1, 2024 | 1811638000 | 5456000000 |
Igniting the spark of knowledge
In the ever-evolving landscape of technology and connectivity, two companies have consistently stood out: TE Connectivity Ltd. and PTC Inc. Over the past decade, these industry leaders have showcased remarkable growth in their gross profits, reflecting their strategic prowess and market adaptability.
From 2014 to 2024, TE Connectivity Ltd. has seen a robust increase in gross profit, peaking at approximately 5.5 billion in 2024, a 16% rise from 2014. Meanwhile, PTC Inc. has demonstrated an impressive upward trajectory, with gross profits surging by nearly 84% over the same period, reaching around 1.8 billion in 2024.
This data not only highlights the resilience and innovation of these companies but also underscores the dynamic nature of the tech industry. As we look to the future, the trends suggest continued growth and competition, promising exciting developments for stakeholders and consumers alike.
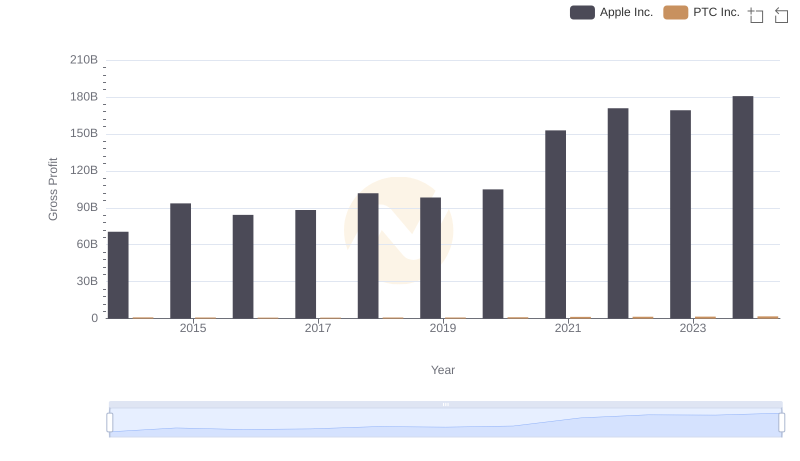
Gross Profit Comparison: Apple Inc. and PTC Inc. Trends
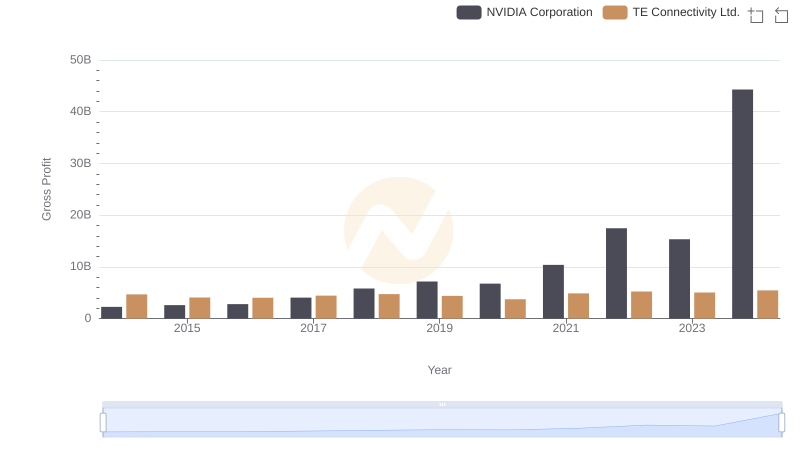
Gross Profit Trends Compared: NVIDIA Corporation vs TE Connectivity Ltd.
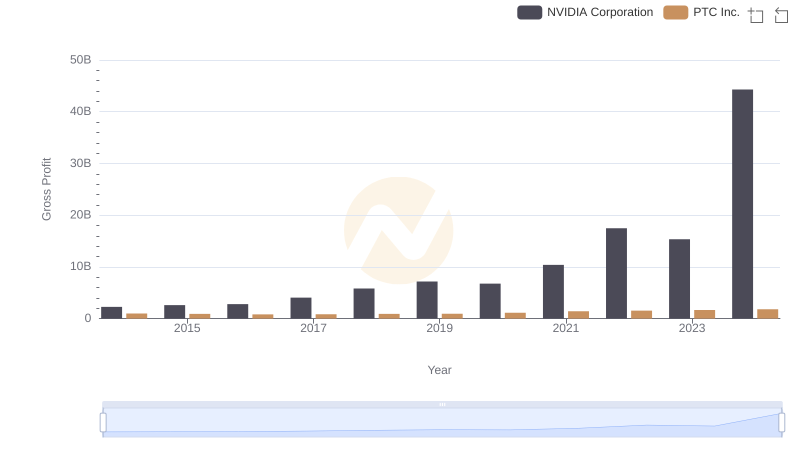
Gross Profit Comparison: NVIDIA Corporation and PTC Inc. Trends
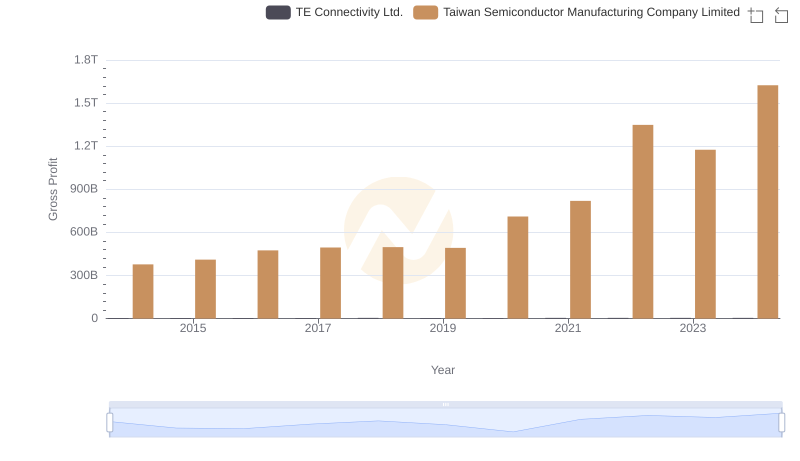
Gross Profit Comparison: Taiwan Semiconductor Manufacturing Company Limited and TE Connectivity Ltd. Trends
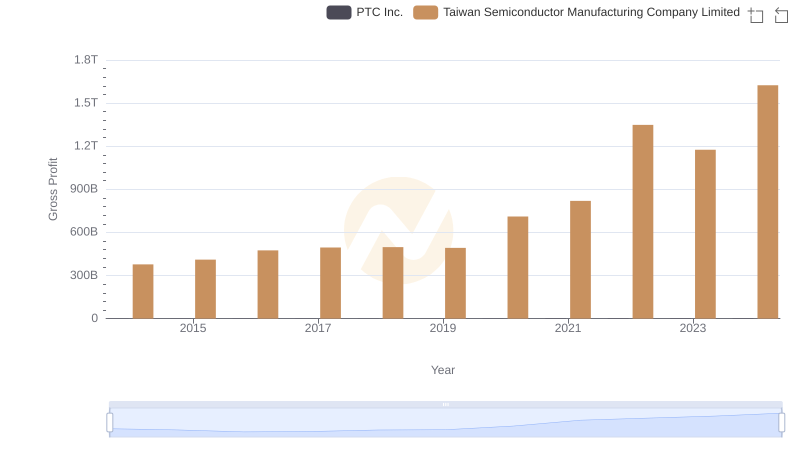
Key Insights on Gross Profit: Taiwan Semiconductor Manufacturing Company Limited vs PTC Inc.
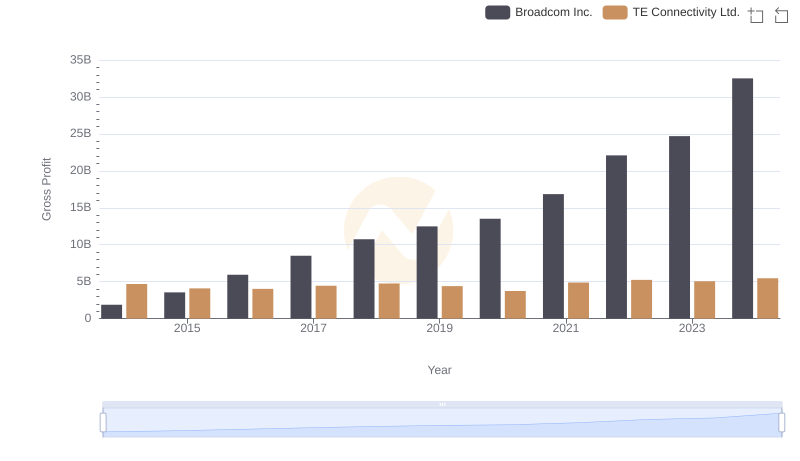
Broadcom Inc. vs TE Connectivity Ltd.: A Gross Profit Performance Breakdown
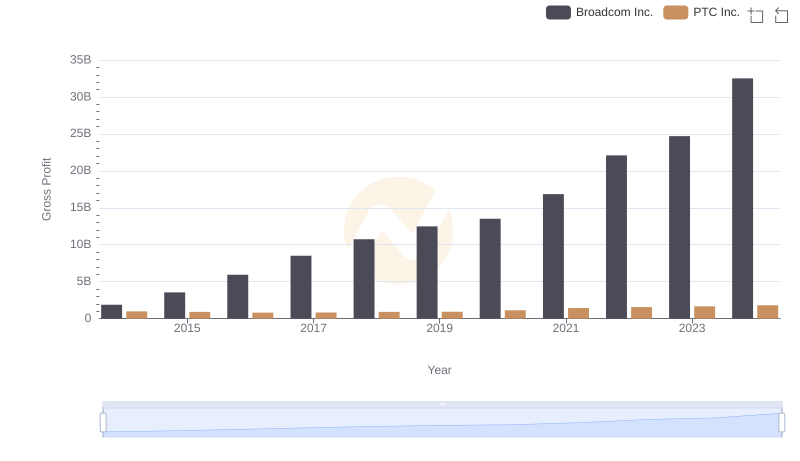
Broadcom Inc. and PTC Inc.: A Detailed Gross Profit Analysis
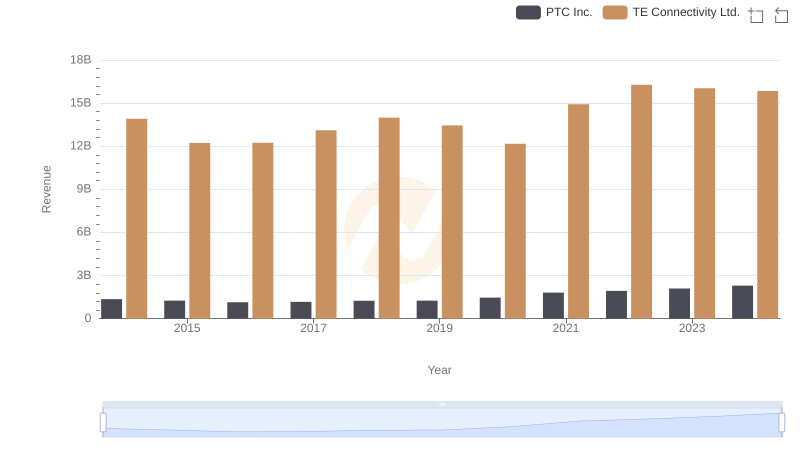
Revenue Showdown: TE Connectivity Ltd. vs PTC Inc.
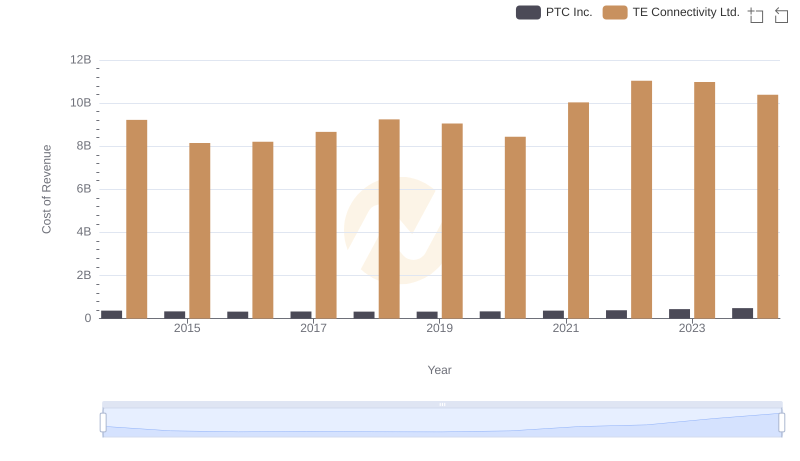
Cost of Revenue Trends: TE Connectivity Ltd. vs PTC Inc.
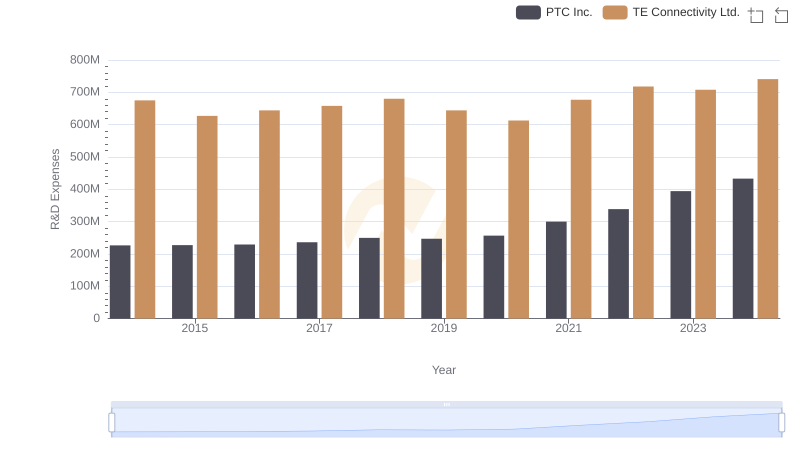
Analyzing R&D Budgets: TE Connectivity Ltd. vs PTC Inc.
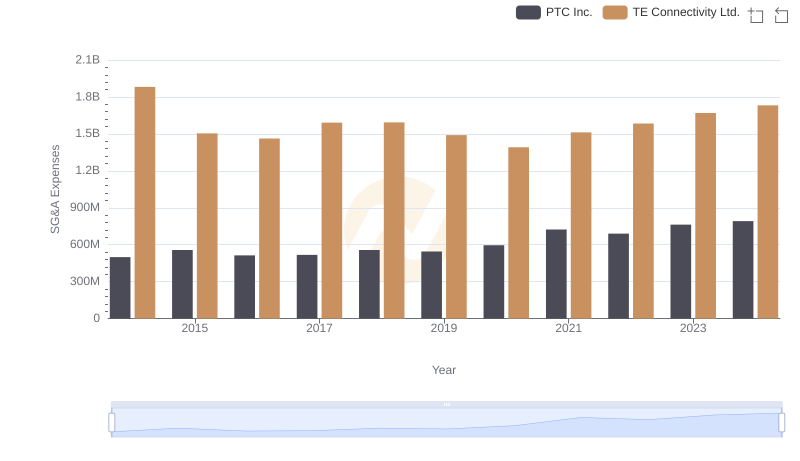
TE Connectivity Ltd. or PTC Inc.: Who Manages SG&A Costs Better?
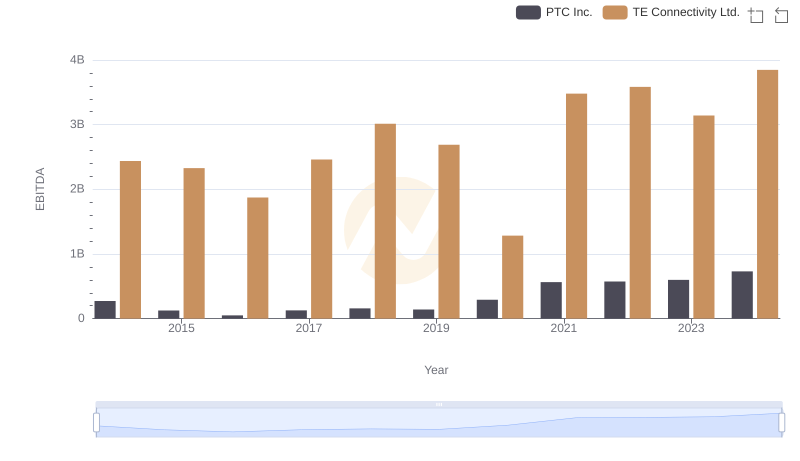
A Side-by-Side Analysis of EBITDA: TE Connectivity Ltd. and PTC Inc.