| __timestamp | PTC Inc. | TE Connectivity Ltd. |
|---|---|---|
| Wednesday, January 1, 2014 | 271574000 | 2438000000 |
| Thursday, January 1, 2015 | 125699999 | 2327000000 |
| Friday, January 1, 2016 | 49244000 | 1874000000 |
| Sunday, January 1, 2017 | 127736000 | 2461000000 |
| Monday, January 1, 2018 | 157737000 | 3014000000 |
| Tuesday, January 1, 2019 | 141171000 | 2689000000 |
| Wednesday, January 1, 2020 | 291951000 | 1283000000 |
| Friday, January 1, 2021 | 564767000 | 3479000000 |
| Saturday, January 1, 2022 | 573406000 | 3584000000 |
| Sunday, January 1, 2023 | 599145000 | 3142000000 |
| Monday, January 1, 2024 | 730022000 | 3848000000 |
Cracking the code
In the ever-evolving landscape of technology and connectivity, understanding financial performance is crucial. This analysis delves into the EBITDA trends of TE Connectivity Ltd. and PTC Inc. from 2014 to 2024. Over this decade, TE Connectivity consistently outperformed PTC Inc., with EBITDA figures often more than ten times higher. Notably, TE Connectivity's EBITDA peaked in 2024, showcasing a robust 58% increase from its 2016 low. Meanwhile, PTC Inc. demonstrated a remarkable recovery, with a 1,382% surge in EBITDA from 2016 to 2024. This growth trajectory highlights PTC Inc.'s strategic advancements in the tech sector. As we navigate through these financial insights, it's evident that both companies have adapted to market demands, albeit at different scales and paces. This analysis underscores the dynamic nature of the tech industry and the importance of strategic financial planning.
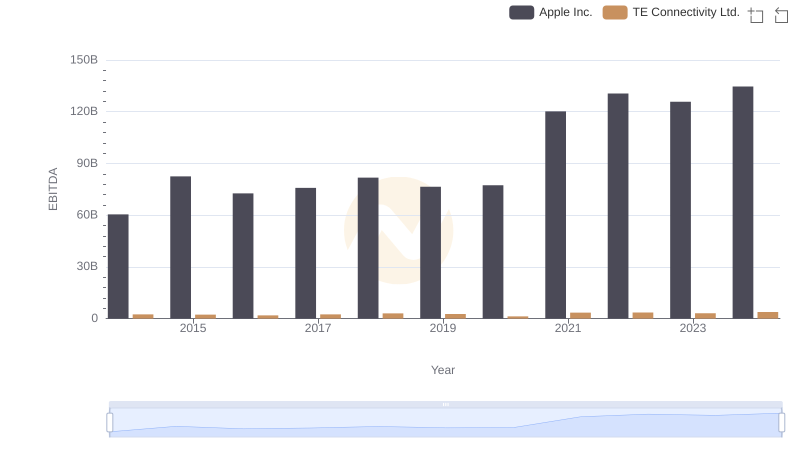
EBITDA Metrics Evaluated: Apple Inc. vs TE Connectivity Ltd.
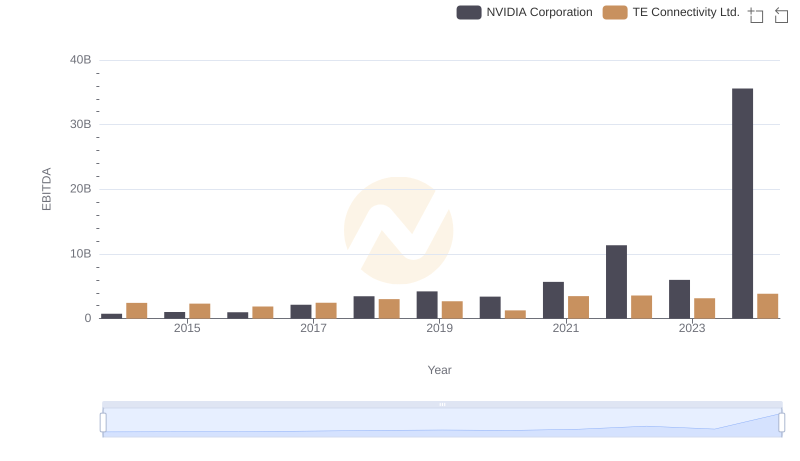
NVIDIA Corporation and TE Connectivity Ltd.: A Detailed Examination of EBITDA Performance
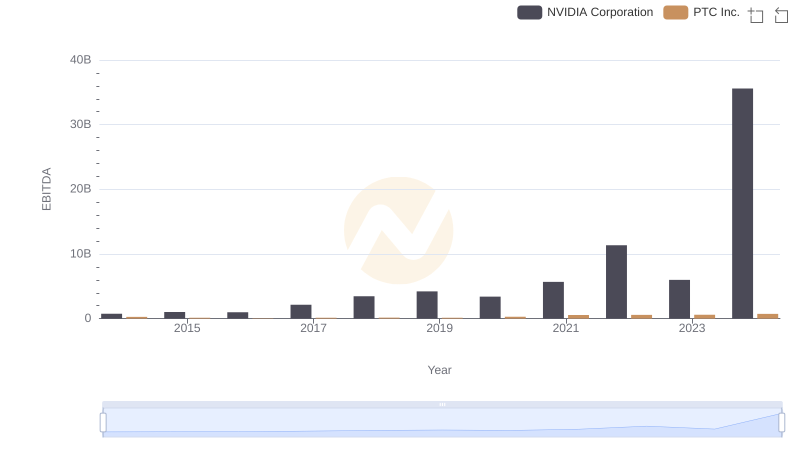
EBITDA Metrics Evaluated: NVIDIA Corporation vs PTC Inc.
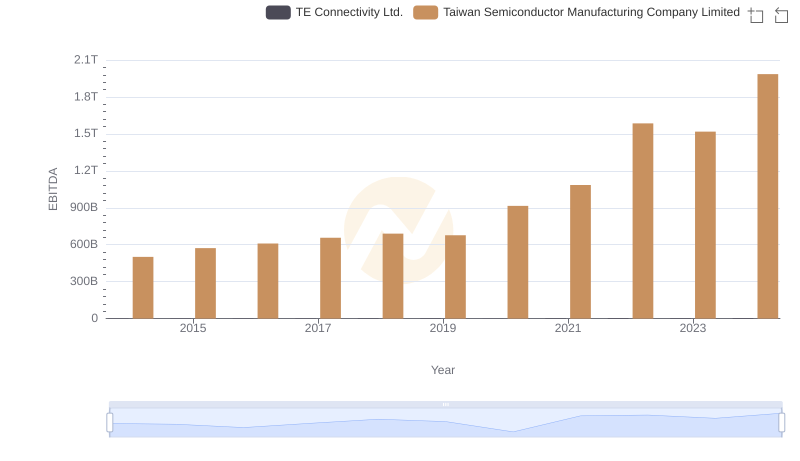
Taiwan Semiconductor Manufacturing Company Limited and TE Connectivity Ltd.: A Detailed Examination of EBITDA Performance
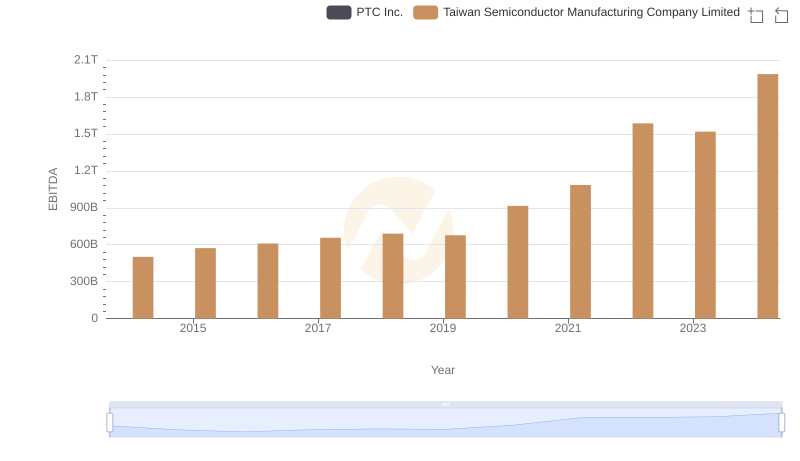
A Professional Review of EBITDA: Taiwan Semiconductor Manufacturing Company Limited Compared to PTC Inc.
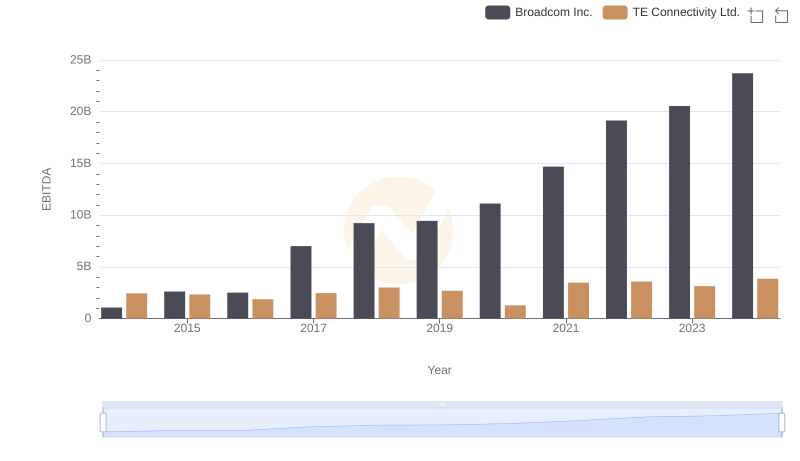
A Professional Review of EBITDA: Broadcom Inc. Compared to TE Connectivity Ltd.
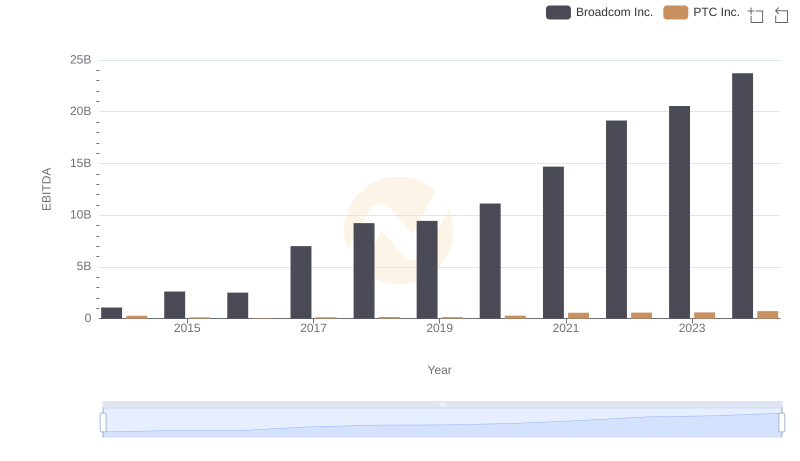
EBITDA Analysis: Evaluating Broadcom Inc. Against PTC Inc.
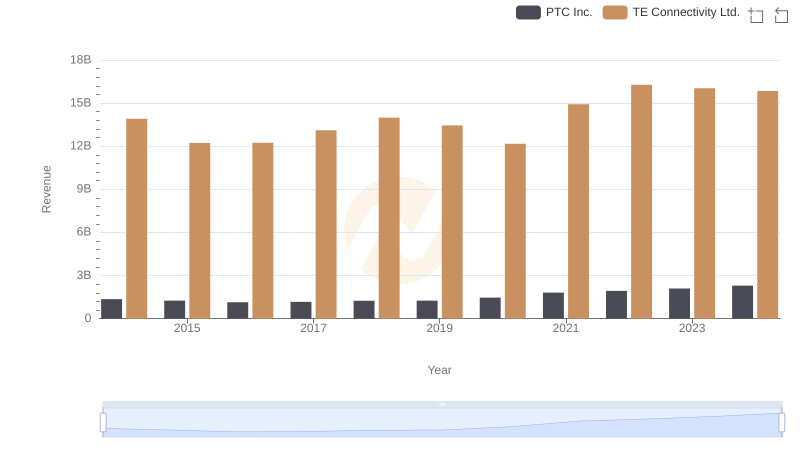
Revenue Showdown: TE Connectivity Ltd. vs PTC Inc.
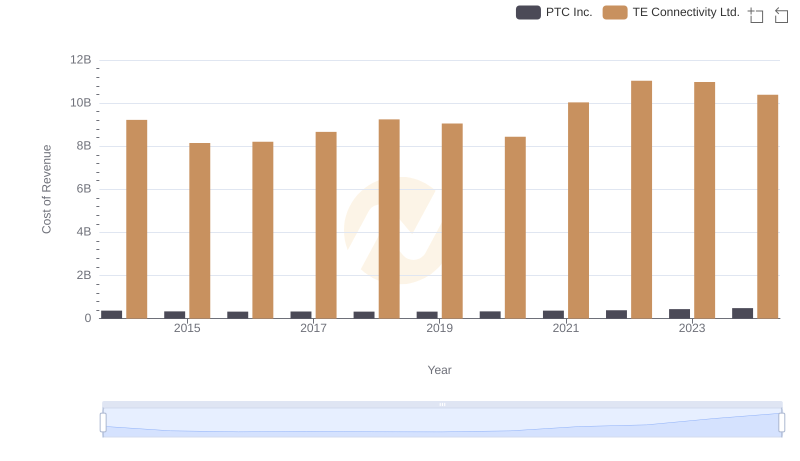
Cost of Revenue Trends: TE Connectivity Ltd. vs PTC Inc.
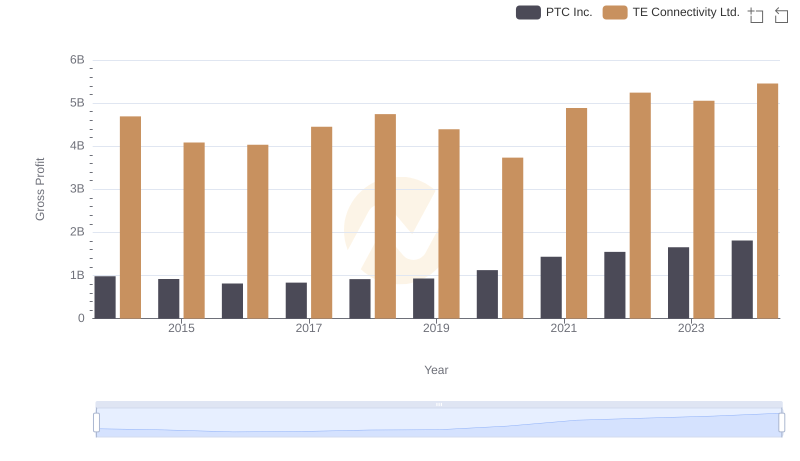
Gross Profit Comparison: TE Connectivity Ltd. and PTC Inc. Trends
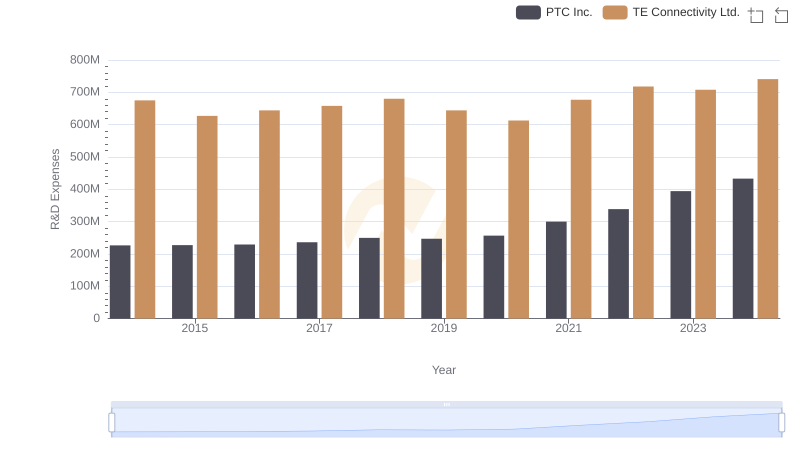
Analyzing R&D Budgets: TE Connectivity Ltd. vs PTC Inc.
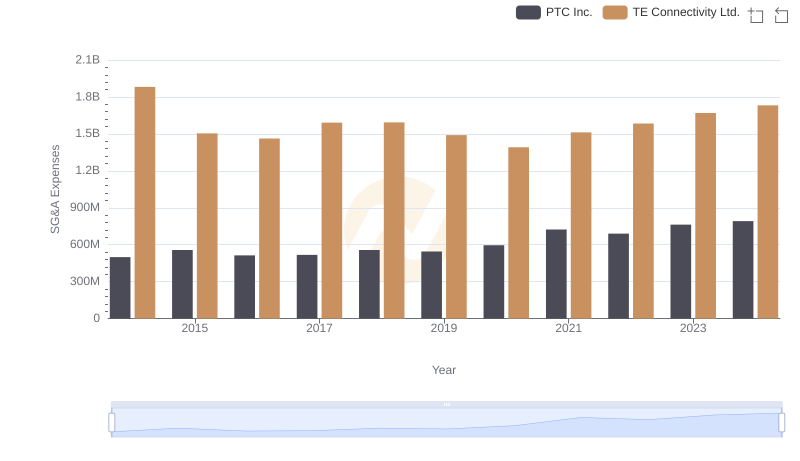
TE Connectivity Ltd. or PTC Inc.: Who Manages SG&A Costs Better?