| __timestamp | PTC Inc. | TE Connectivity Ltd. |
|---|---|---|
| Wednesday, January 1, 2014 | 373683000 | 9220000000 |
| Thursday, January 1, 2015 | 334734000 | 8146000000 |
| Friday, January 1, 2016 | 325665000 | 8205000000 |
| Sunday, January 1, 2017 | 329019000 | 8663000000 |
| Monday, January 1, 2018 | 326194000 | 9243000000 |
| Tuesday, January 1, 2019 | 325378000 | 9054000000 |
| Wednesday, January 1, 2020 | 334271000 | 8437000000 |
| Friday, January 1, 2021 | 371102000 | 10036000000 |
| Saturday, January 1, 2022 | 385980000 | 11037000000 |
| Sunday, January 1, 2023 | 441006000 | 10979000000 |
| Monday, January 1, 2024 | 486834000 | 10389000000 |
Unlocking the unknown
In the ever-evolving landscape of technology and connectivity, understanding cost structures is crucial. TE Connectivity Ltd. and PTC Inc., two giants in their respective fields, have shown distinct trends in their cost of revenue over the past decade. From 2014 to 2024, TE Connectivity's cost of revenue has seen a steady increase, peaking in 2022 with a 35% rise from 2014. Meanwhile, PTC Inc. has experienced a more modest growth, with a 30% increase over the same period. Notably, 2023 marked a significant year for both companies, with TE Connectivity's costs slightly declining by 5% from its peak, while PTC Inc. saw a 14% jump. These trends reflect broader industry shifts and strategic decisions, offering valuable insights for investors and stakeholders. As we look to the future, monitoring these cost dynamics will be key to understanding the competitive landscape.
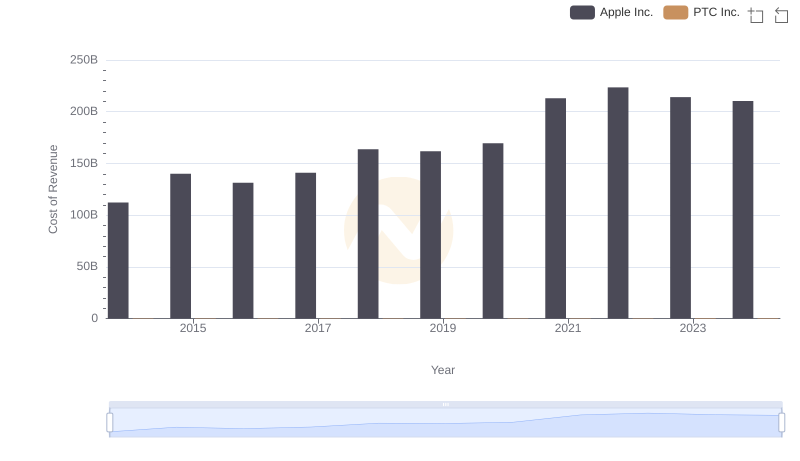
Cost of Revenue: Key Insights for Apple Inc. and PTC Inc.
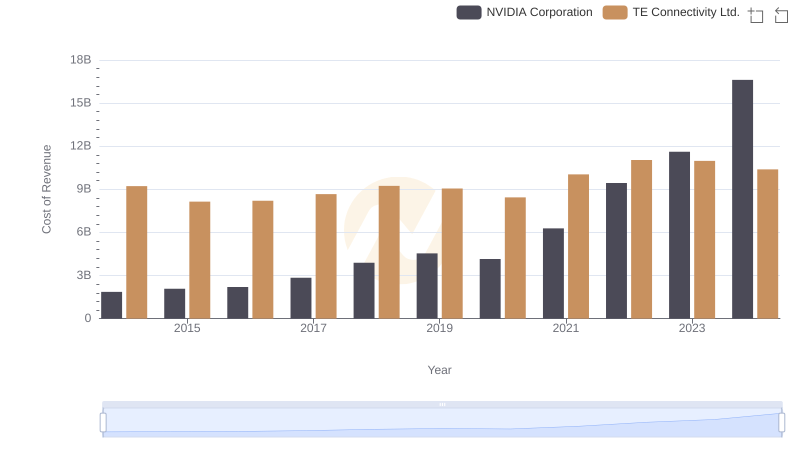
NVIDIA Corporation vs TE Connectivity Ltd.: Efficiency in Cost of Revenue Explored
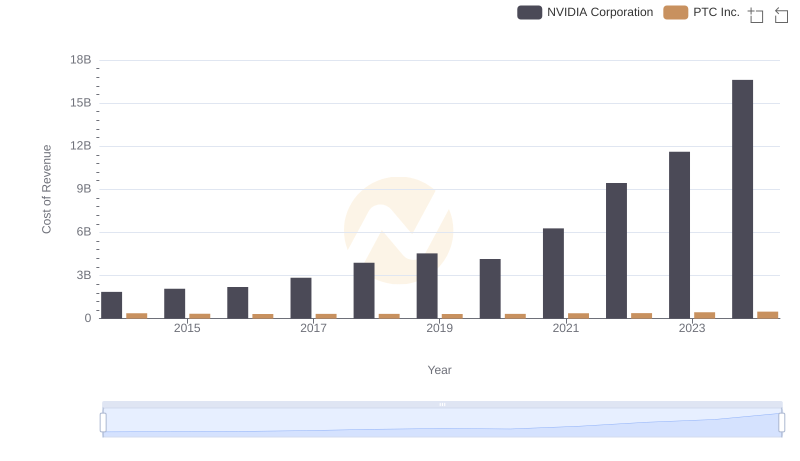
Cost of Revenue Comparison: NVIDIA Corporation vs PTC Inc.
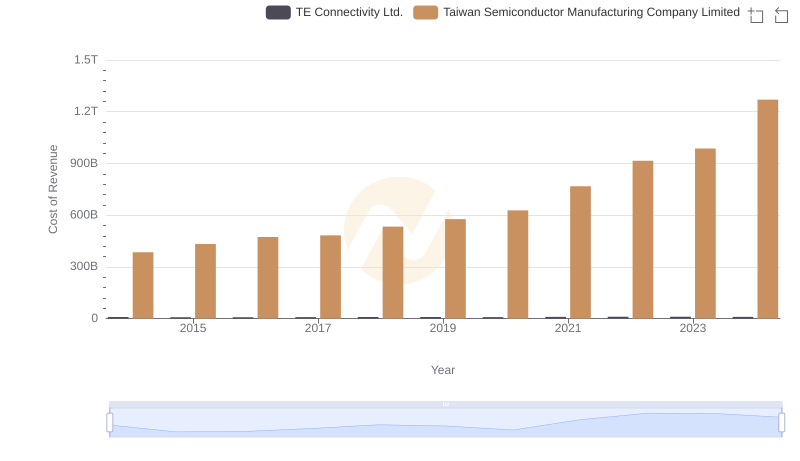
Cost of Revenue: Key Insights for Taiwan Semiconductor Manufacturing Company Limited and TE Connectivity Ltd.
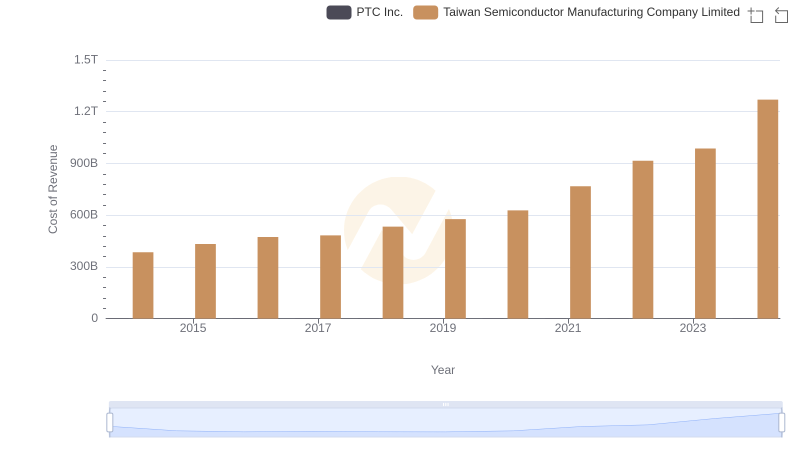
Comparing Cost of Revenue Efficiency: Taiwan Semiconductor Manufacturing Company Limited vs PTC Inc.
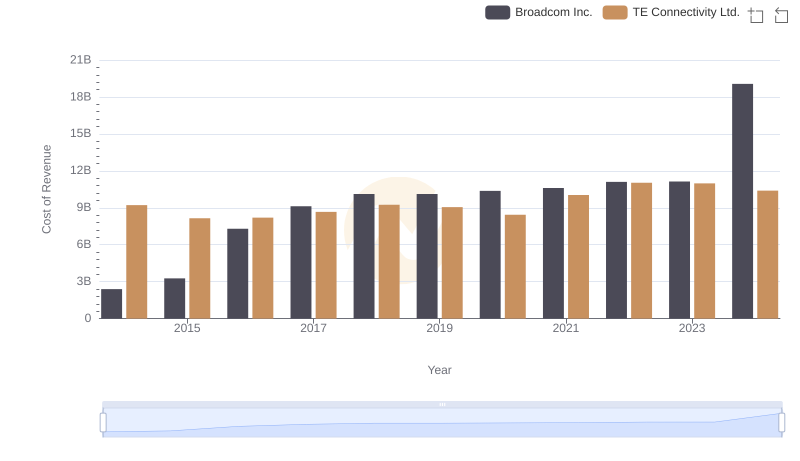
Broadcom Inc. vs TE Connectivity Ltd.: Efficiency in Cost of Revenue Explored
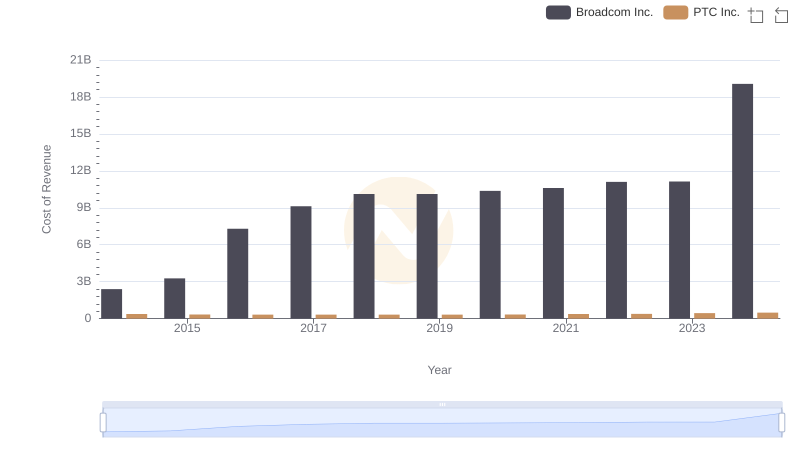
Analyzing Cost of Revenue: Broadcom Inc. and PTC Inc.
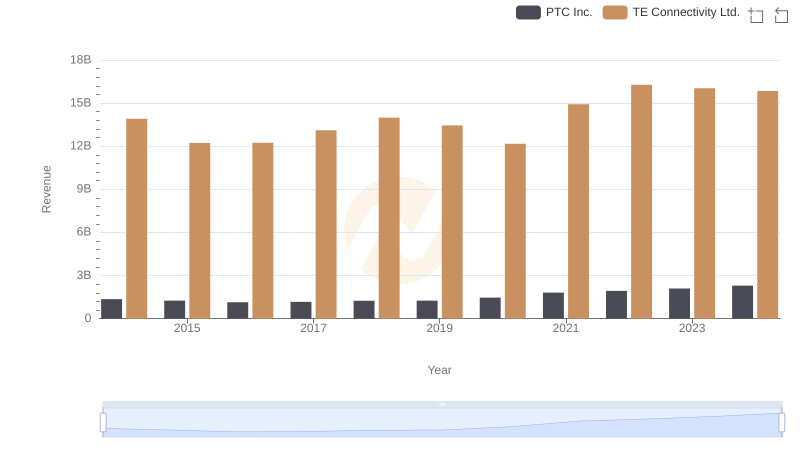
Revenue Showdown: TE Connectivity Ltd. vs PTC Inc.
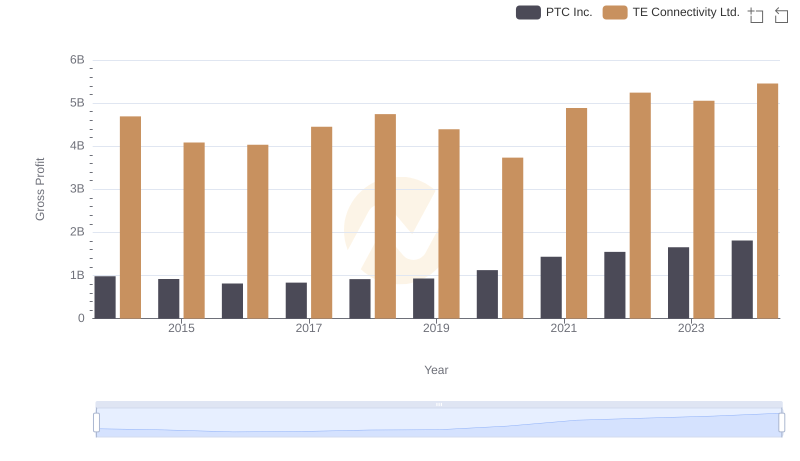
Gross Profit Comparison: TE Connectivity Ltd. and PTC Inc. Trends
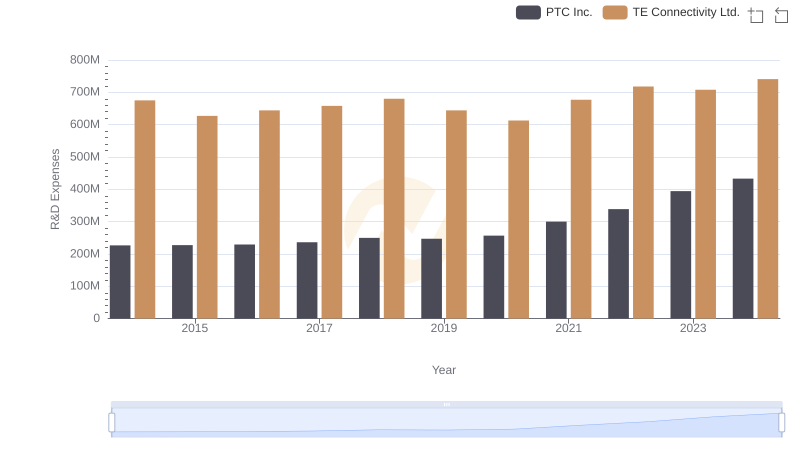
Analyzing R&D Budgets: TE Connectivity Ltd. vs PTC Inc.
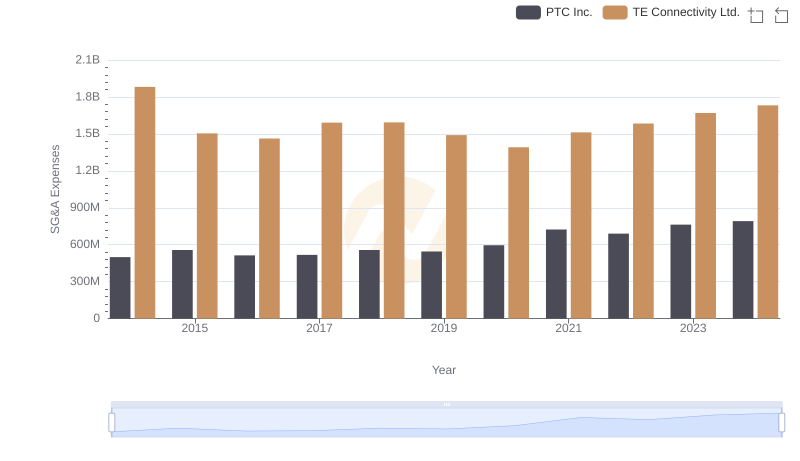
TE Connectivity Ltd. or PTC Inc.: Who Manages SG&A Costs Better?
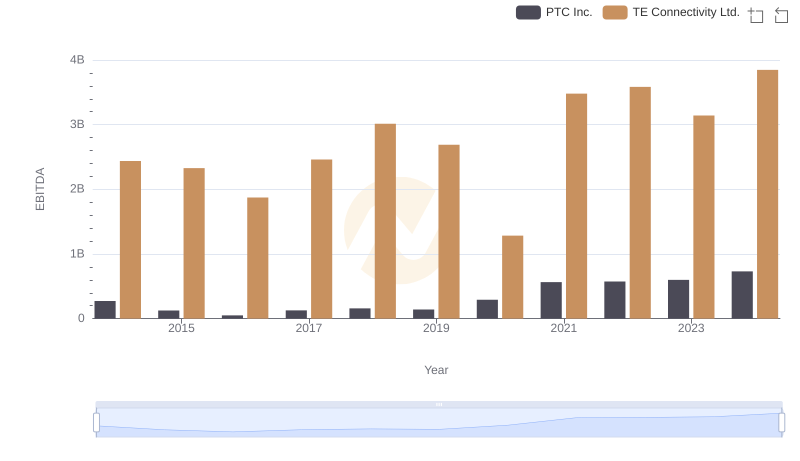
A Side-by-Side Analysis of EBITDA: TE Connectivity Ltd. and PTC Inc.