| __timestamp | Eaton Corporation plc | United Airlines Holdings, Inc. |
|---|---|---|
| Wednesday, January 1, 2014 | 22552000000 | 38901000000 |
| Thursday, January 1, 2015 | 20855000000 | 37864000000 |
| Friday, January 1, 2016 | 19747000000 | 36556000000 |
| Sunday, January 1, 2017 | 20404000000 | 37736000000 |
| Monday, January 1, 2018 | 21609000000 | 41303000000 |
| Tuesday, January 1, 2019 | 21390000000 | 43259000000 |
| Wednesday, January 1, 2020 | 17858000000 | 15355000000 |
| Friday, January 1, 2021 | 19628000000 | 24634000000 |
| Saturday, January 1, 2022 | 20752000000 | 44955000000 |
| Sunday, January 1, 2023 | 23196000000 | 53717000000 |
| Monday, January 1, 2024 | 24878000000 | 57063000000 |
In pursuit of knowledge
In the ever-evolving landscape of global business, understanding revenue trends is crucial for investors and stakeholders. This analysis delves into the financial performance of Eaton Corporation plc and United Airlines Holdings, Inc. over the past decade, from 2014 to 2023.
Eaton Corporation plc, a leader in power management, has shown a steady revenue trajectory. Despite a dip in 2020, likely due to global economic challenges, Eaton's revenue rebounded by 30% by 2023, reaching its highest point in the decade.
United Airlines Holdings, Inc. experienced more volatility, with a significant revenue drop in 2020, reflecting the pandemic's impact on the airline industry. However, by 2023, United Airlines' revenue surged by 250% from its 2020 low, showcasing a robust recovery.
These insights highlight the resilience and adaptability of these industry giants in the face of economic fluctuations.

Breaking Down Revenue Trends: Eaton Corporation plc vs Ingersoll Rand Inc.

Revenue Insights: Eaton Corporation plc and Ferguson plc Performance Compared
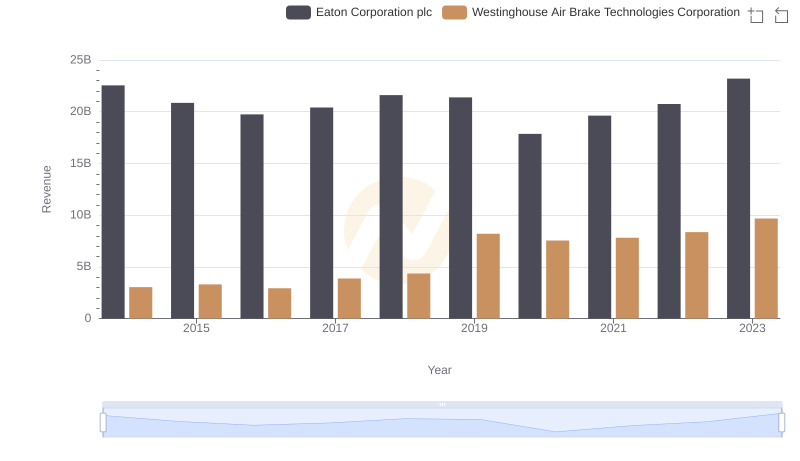
Comparing Revenue Performance: Eaton Corporation plc or Westinghouse Air Brake Technologies Corporation?
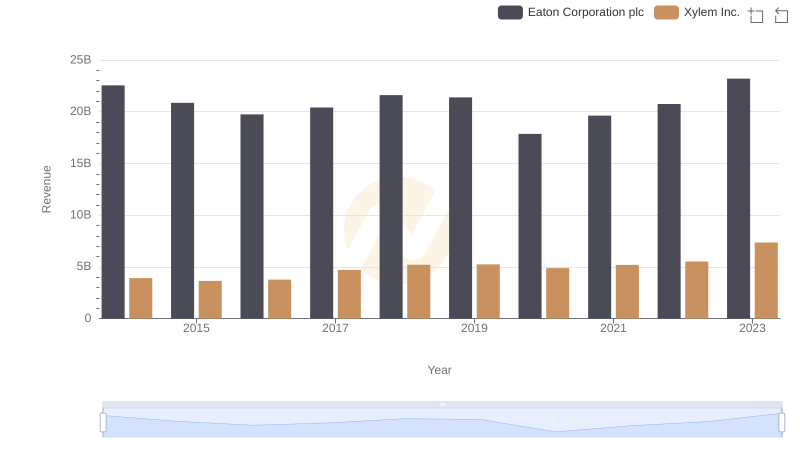
Revenue Insights: Eaton Corporation plc and Xylem Inc. Performance Compared
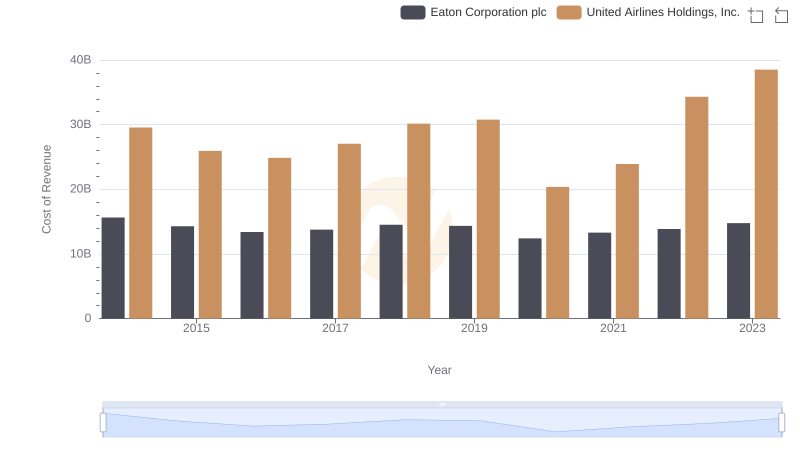
Analyzing Cost of Revenue: Eaton Corporation plc and United Airlines Holdings, Inc.