| __timestamp | Eaton Corporation plc | Ferguson plc |
|---|---|---|
| Wednesday, January 1, 2014 | 22552000000 | 22198928094 |
| Thursday, January 1, 2015 | 20855000000 | 20800698973 |
| Friday, January 1, 2016 | 19747000000 | 19066872795 |
| Sunday, January 1, 2017 | 20404000000 | 20009463224 |
| Monday, January 1, 2018 | 21609000000 | 20752000000 |
| Tuesday, January 1, 2019 | 21390000000 | 22010000000 |
| Wednesday, January 1, 2020 | 17858000000 | 21819000000 |
| Friday, January 1, 2021 | 19628000000 | 22792000000 |
| Saturday, January 1, 2022 | 20752000000 | 28566000000 |
| Sunday, January 1, 2023 | 23196000000 | 29734000000 |
| Monday, January 1, 2024 | 24878000000 | 29635000000 |
Cracking the code
In the ever-evolving landscape of industrial giants, Eaton Corporation plc and Ferguson plc have consistently demonstrated their prowess. From 2014 to 2023, Eaton's revenue trajectory reveals a steady climb, peaking in 2023 with a 30% increase from its 2020 low. Meanwhile, Ferguson plc has shown remarkable growth, with a 56% surge in revenue over the same period, culminating in 2023. Notably, Ferguson's revenue in 2023 surpassed Eaton's by approximately 28%, highlighting its robust market position. However, the data for 2024 remains incomplete, leaving room for speculation on future trends. This analysis underscores the dynamic nature of the industrial sector, where strategic decisions and market conditions play pivotal roles in shaping financial outcomes. As we look to the future, the performance of these companies will be closely watched by investors and industry analysts alike.

Breaking Down Revenue Trends: Eaton Corporation plc vs Ingersoll Rand Inc.
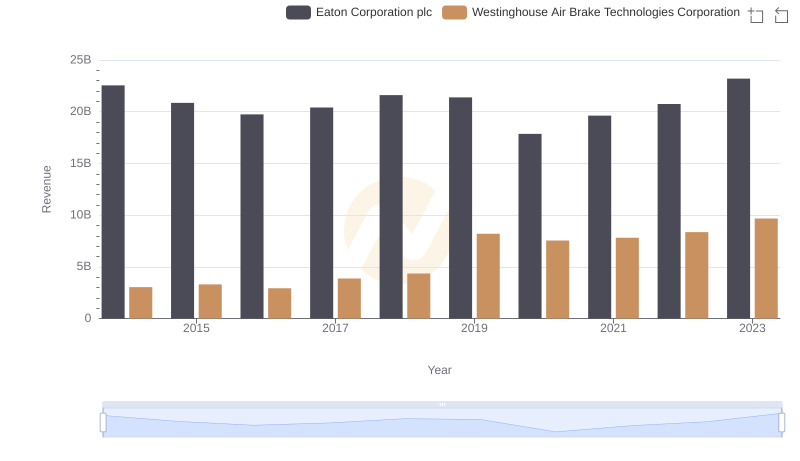
Comparing Revenue Performance: Eaton Corporation plc or Westinghouse Air Brake Technologies Corporation?
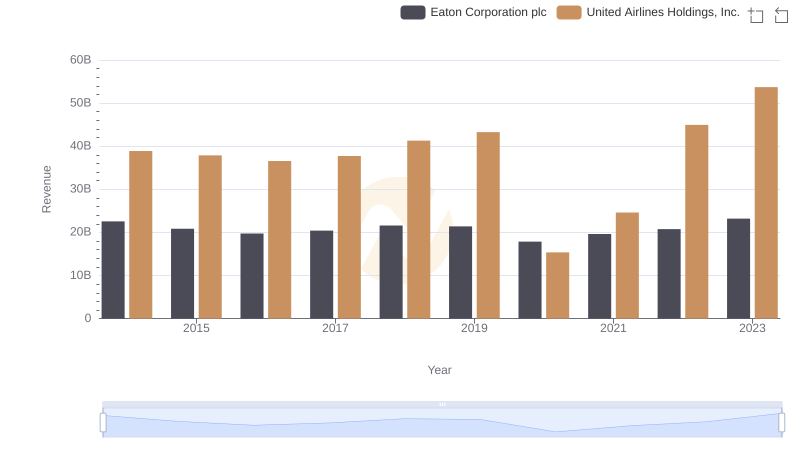
Revenue Insights: Eaton Corporation plc and United Airlines Holdings, Inc. Performance Compared
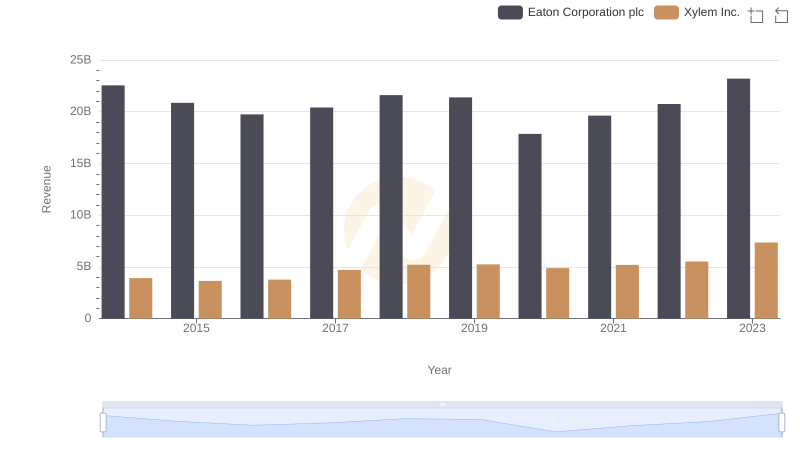
Revenue Insights: Eaton Corporation plc and Xylem Inc. Performance Compared