| __timestamp | Eaton Corporation plc | United Airlines Holdings, Inc. |
|---|---|---|
| Wednesday, January 1, 2014 | 15646000000 | 29569000000 |
| Thursday, January 1, 2015 | 14292000000 | 25952000000 |
| Friday, January 1, 2016 | 13400000000 | 24856000000 |
| Sunday, January 1, 2017 | 13756000000 | 27056000000 |
| Monday, January 1, 2018 | 14511000000 | 30165000000 |
| Tuesday, January 1, 2019 | 14338000000 | 30786000000 |
| Wednesday, January 1, 2020 | 12408000000 | 20385000000 |
| Friday, January 1, 2021 | 13293000000 | 23913000000 |
| Saturday, January 1, 2022 | 13865000000 | 34315000000 |
| Sunday, January 1, 2023 | 14763000000 | 38518000000 |
| Monday, January 1, 2024 | 15375000000 | 37643000000 |
Unlocking the unknown
In the ever-evolving landscape of global business, understanding the cost of revenue is crucial for evaluating a company's financial health. This analysis focuses on Eaton Corporation plc and United Airlines Holdings, Inc., two industry leaders with distinct operational models.
From 2014 to 2023, Eaton Corporation plc has demonstrated a consistent approach to managing its cost of revenue. Despite a dip in 2020, likely due to global economic disruptions, Eaton's cost of revenue has shown a steady upward trend, culminating in a 19% increase by 2023.
United Airlines, on the other hand, faced more volatility. The airline's cost of revenue plummeted in 2020, reflecting the pandemic's impact on the travel industry. However, by 2023, United Airlines rebounded impressively, with a 90% surge from its 2020 low, showcasing resilience and adaptability.
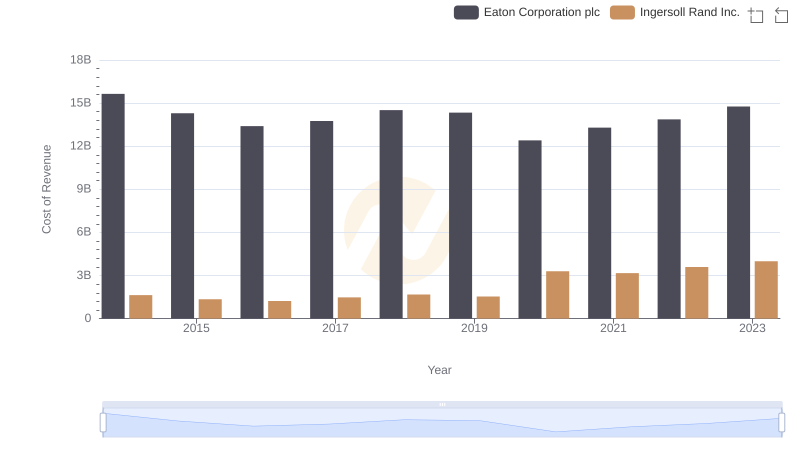
Cost of Revenue Trends: Eaton Corporation plc vs Ingersoll Rand Inc.
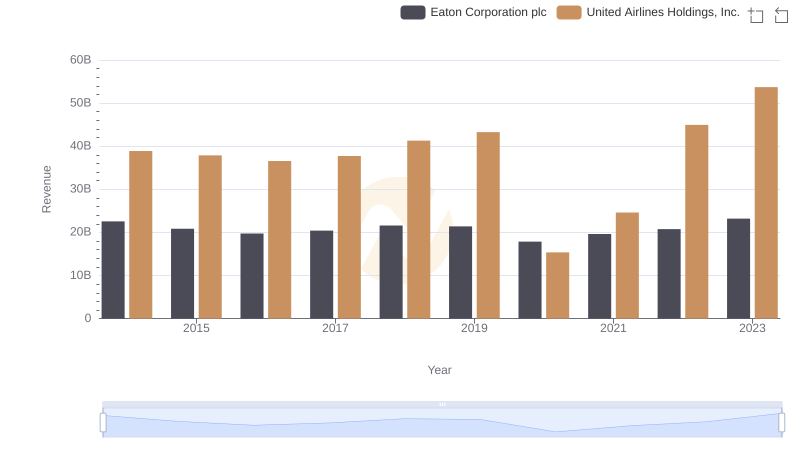
Revenue Insights: Eaton Corporation plc and United Airlines Holdings, Inc. Performance Compared
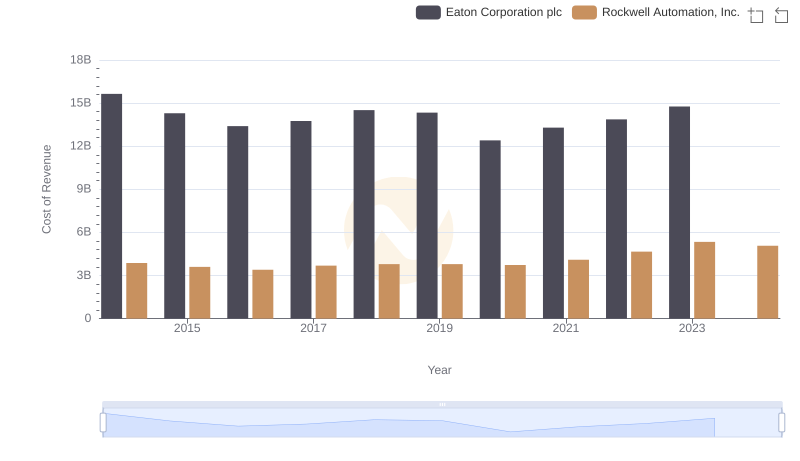
Cost of Revenue Comparison: Eaton Corporation plc vs Rockwell Automation, Inc.
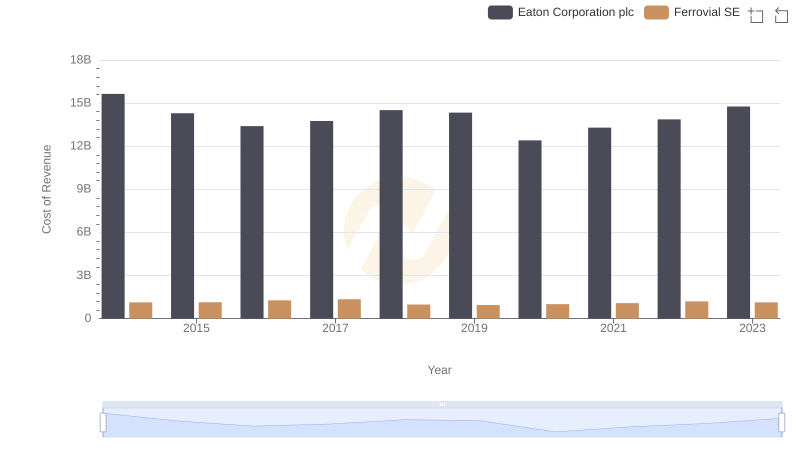
Cost of Revenue Comparison: Eaton Corporation plc vs Ferrovial SE