| __timestamp | Eaton Corporation plc | Xylem Inc. |
|---|---|---|
| Wednesday, January 1, 2014 | 22552000000 | 3916000000 |
| Thursday, January 1, 2015 | 20855000000 | 3653000000 |
| Friday, January 1, 2016 | 19747000000 | 3771000000 |
| Sunday, January 1, 2017 | 20404000000 | 4707000000 |
| Monday, January 1, 2018 | 21609000000 | 5207000000 |
| Tuesday, January 1, 2019 | 21390000000 | 5249000000 |
| Wednesday, January 1, 2020 | 17858000000 | 4876000000 |
| Friday, January 1, 2021 | 19628000000 | 5195000000 |
| Saturday, January 1, 2022 | 20752000000 | 5522000000 |
| Sunday, January 1, 2023 | 23196000000 | 7364000000 |
| Monday, January 1, 2024 | 24878000000 |
Unveiling the hidden dimensions of data
In the ever-evolving landscape of industrial innovation, Eaton Corporation plc and Xylem Inc. have emerged as key players. Over the past decade, Eaton's revenue has shown a steady upward trajectory, peaking in 2023 with a remarkable 15% increase from 2022. This growth reflects Eaton's strategic focus on energy-efficient solutions. Meanwhile, Xylem Inc., a leader in water technology, has experienced a significant revenue surge, particularly in 2023, where it saw a 33% increase compared to the previous year. This leap underscores the rising global demand for sustainable water management solutions. From 2014 to 2023, Eaton's revenue averaged around $20.8 billion annually, while Xylem's averaged approximately $4.9 billion. These figures highlight the contrasting scales and growth strategies of these two industrial giants. As the world pivots towards sustainability, both companies are well-positioned to capitalize on emerging opportunities.
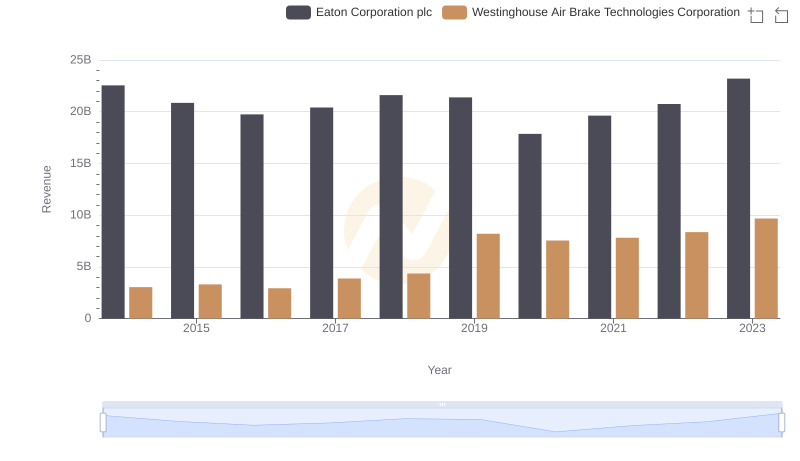
Comparing Revenue Performance: Eaton Corporation plc or Westinghouse Air Brake Technologies Corporation?
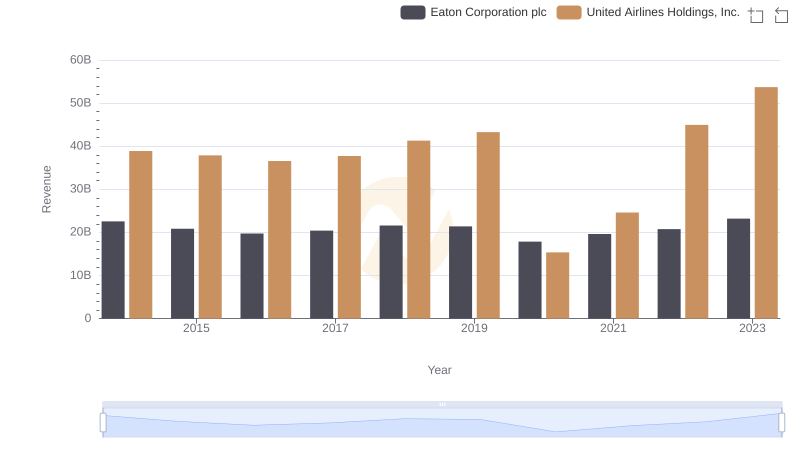
Revenue Insights: Eaton Corporation plc and United Airlines Holdings, Inc. Performance Compared
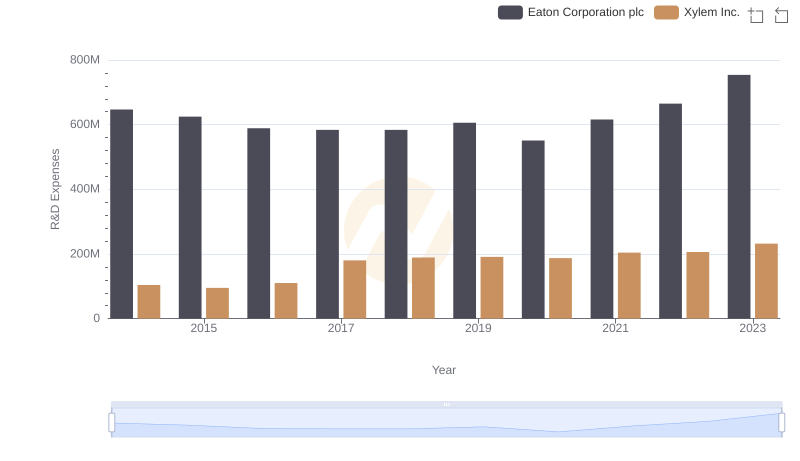
Research and Development Investment: Eaton Corporation plc vs Xylem Inc.
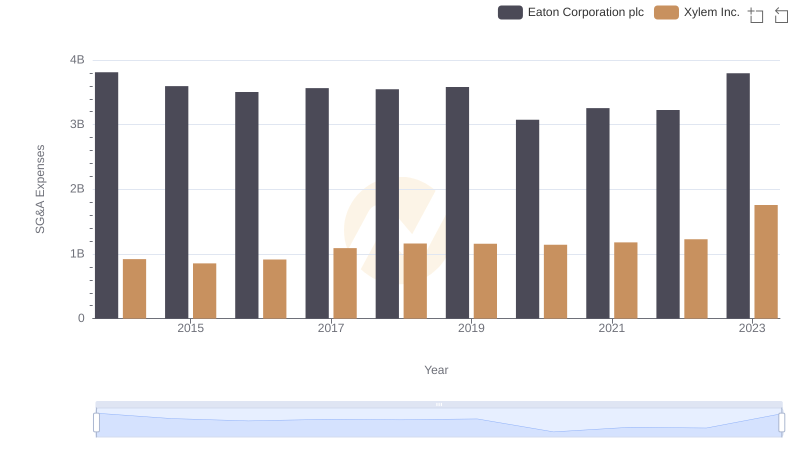
Breaking Down SG&A Expenses: Eaton Corporation plc vs Xylem Inc.
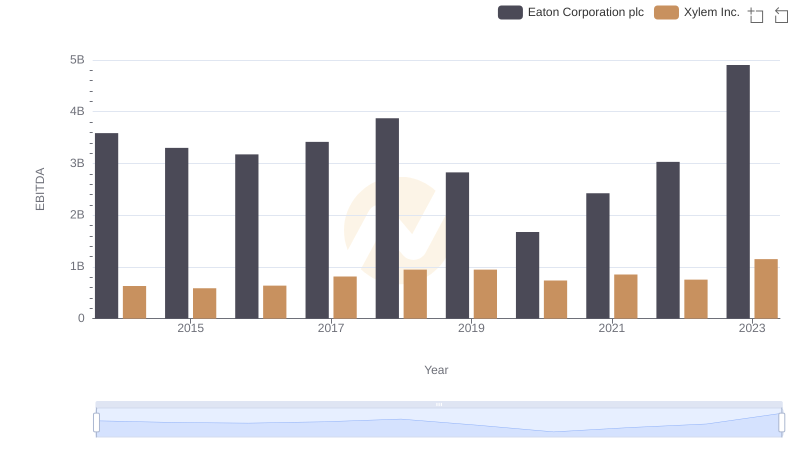
Comparative EBITDA Analysis: Eaton Corporation plc vs Xylem Inc.