| __timestamp | Eaton Corporation plc | Ingersoll Rand Inc. |
|---|---|---|
| Wednesday, January 1, 2014 | 22552000000 | 2570005000 |
| Thursday, January 1, 2015 | 20855000000 | 2126900000 |
| Friday, January 1, 2016 | 19747000000 | 1939436000 |
| Sunday, January 1, 2017 | 20404000000 | 2375400000 |
| Monday, January 1, 2018 | 21609000000 | 2689800000 |
| Tuesday, January 1, 2019 | 21390000000 | 2451900000 |
| Wednesday, January 1, 2020 | 17858000000 | 4910200000 |
| Friday, January 1, 2021 | 19628000000 | 5152400000 |
| Saturday, January 1, 2022 | 20752000000 | 5916300000 |
| Sunday, January 1, 2023 | 23196000000 | 6876100000 |
| Monday, January 1, 2024 | 24878000000 | 0 |
In pursuit of knowledge
In the ever-evolving industrial sector, Eaton Corporation plc and Ingersoll Rand Inc. have showcased intriguing revenue trajectories over the past decade. From 2014 to 2023, Eaton's revenue demonstrated a steady growth, peaking in 2023 with a 15% increase from its 2014 figures. In contrast, Ingersoll Rand's revenue surged by an impressive 167% during the same period, reflecting its dynamic market strategies and expansion efforts.
The year 2020 marked a pivotal point for both companies, with Eaton experiencing a dip, likely due to global economic challenges, while Ingersoll Rand capitalized on market opportunities, nearly doubling its revenue. By 2023, Eaton's revenue reached its highest, while Ingersoll Rand continued its upward trajectory, underscoring its robust growth strategy.
These trends highlight the resilience and adaptability of these industrial giants, offering valuable insights into their strategic maneuvers in a competitive landscape.

Eaton Corporation plc vs Old Dominion Freight Line, Inc.: Annual Revenue Growth Compared

Revenue Insights: Eaton Corporation plc and Ferguson plc Performance Compared
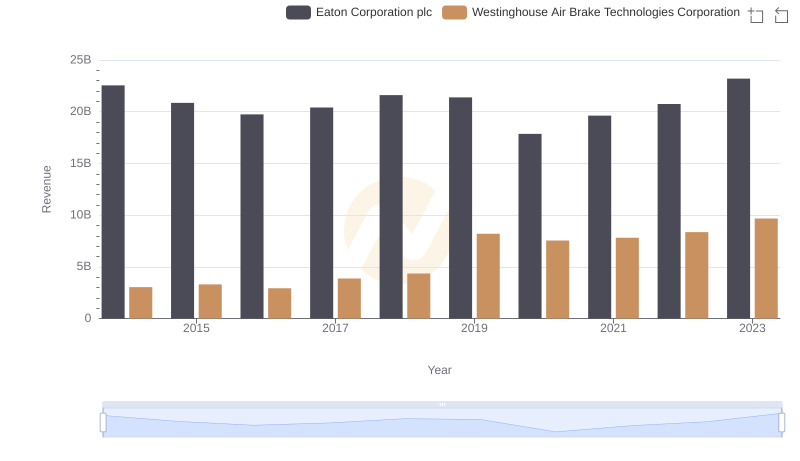
Comparing Revenue Performance: Eaton Corporation plc or Westinghouse Air Brake Technologies Corporation?
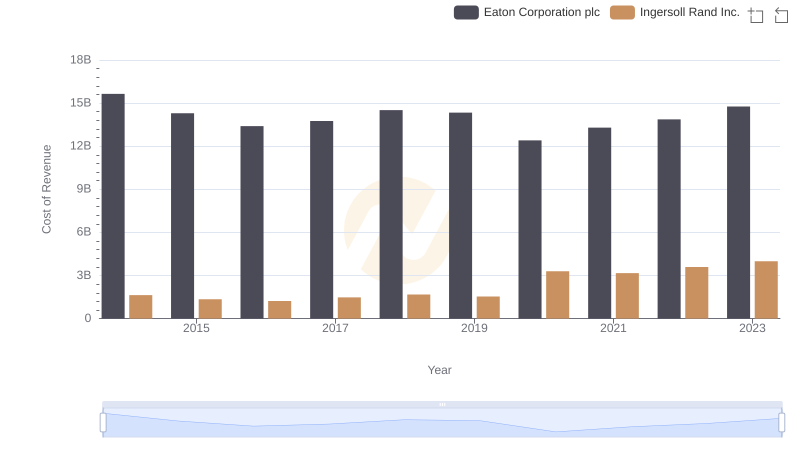
Cost of Revenue Trends: Eaton Corporation plc vs Ingersoll Rand Inc.
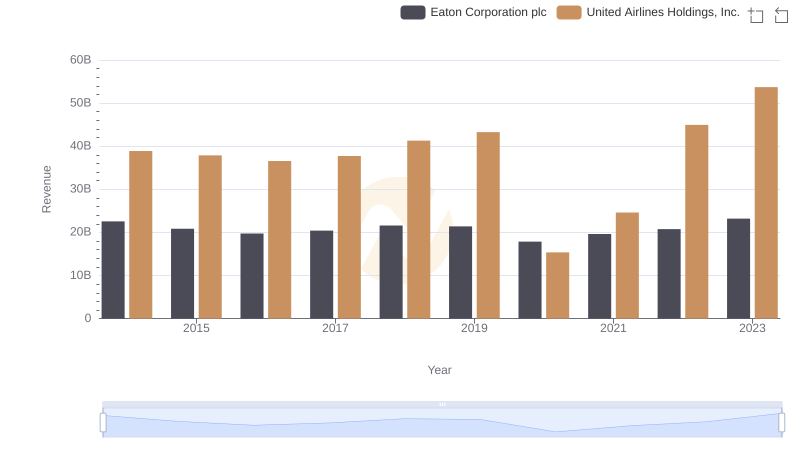
Revenue Insights: Eaton Corporation plc and United Airlines Holdings, Inc. Performance Compared

Research and Development Expenses Breakdown: Eaton Corporation plc vs Ingersoll Rand Inc.
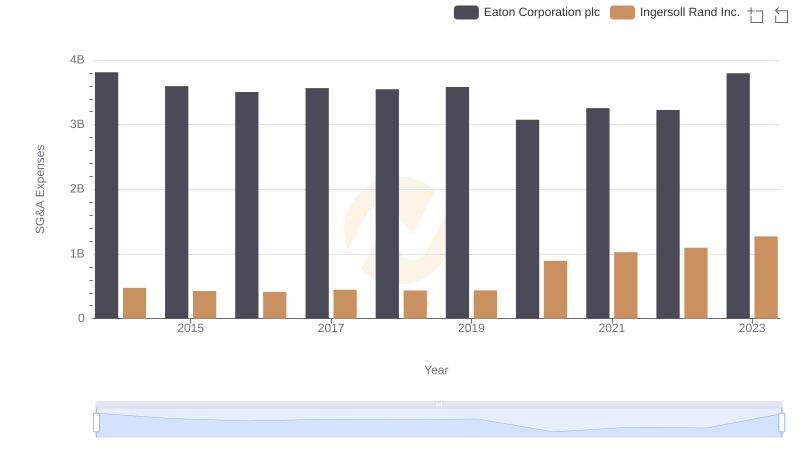
Operational Costs Compared: SG&A Analysis of Eaton Corporation plc and Ingersoll Rand Inc.