| __timestamp | Builders FirstSource, Inc. | Eaton Corporation plc |
|---|---|---|
| Wednesday, January 1, 2014 | 1604096000 | 22552000000 |
| Thursday, January 1, 2015 | 3564425000 | 20855000000 |
| Friday, January 1, 2016 | 6367284000 | 19747000000 |
| Sunday, January 1, 2017 | 7034209000 | 20404000000 |
| Monday, January 1, 2018 | 7724771000 | 21609000000 |
| Tuesday, January 1, 2019 | 7280431000 | 21390000000 |
| Wednesday, January 1, 2020 | 8558874000 | 17858000000 |
| Friday, January 1, 2021 | 19893856000 | 19628000000 |
| Saturday, January 1, 2022 | 22726418000 | 20752000000 |
| Sunday, January 1, 2023 | 17097330000 | 23196000000 |
| Monday, January 1, 2024 | 24878000000 |
Unlocking the unknown
In the competitive landscape of industrial and building materials, Eaton Corporation plc and Builders FirstSource, Inc. have emerged as key players. Over the past decade, Eaton has consistently outperformed Builders FirstSource in terms of annual revenue. From 2014 to 2023, Eaton's revenue has shown remarkable stability, averaging around $20 billion annually, with a peak of $23.2 billion in 2023. In contrast, Builders FirstSource has experienced a more volatile revenue trajectory, with significant growth from $1.6 billion in 2014 to a high of $22.7 billion in 2022, before a slight dip in 2023.
Eaton's steady performance highlights its resilience and strong market position, while Builders FirstSource's rapid growth underscores its dynamic expansion strategy. As the industry evolves, these two giants continue to shape the future of industrial and building materials, each with its unique strengths and challenges.
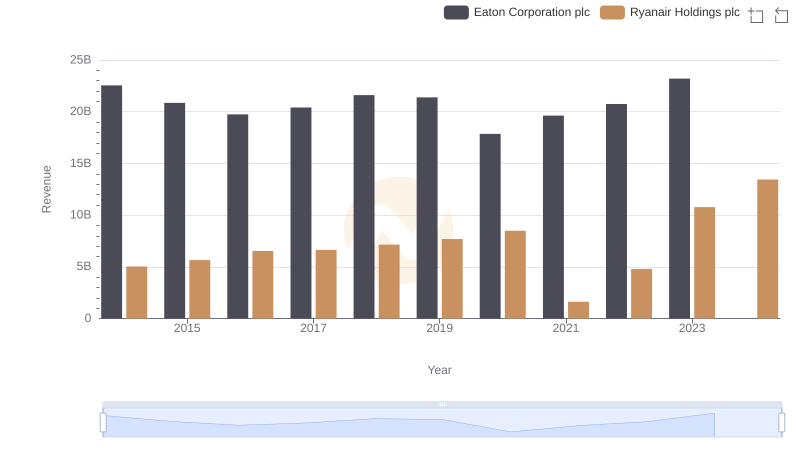
Breaking Down Revenue Trends: Eaton Corporation plc vs Ryanair Holdings plc
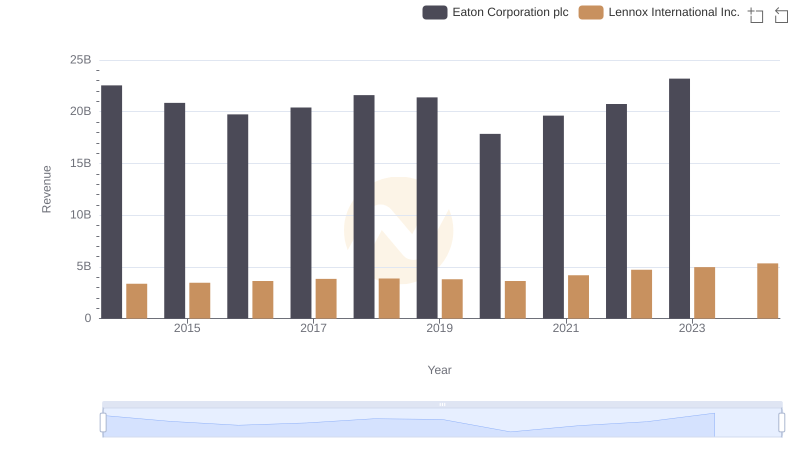
Revenue Insights: Eaton Corporation plc and Lennox International Inc. Performance Compared
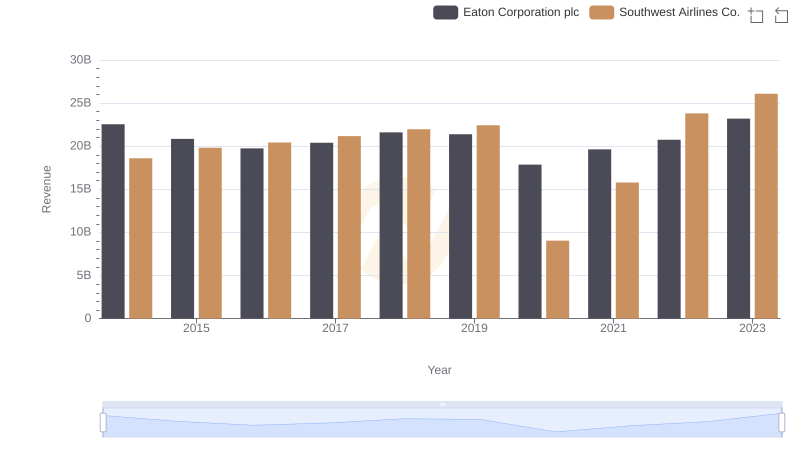
Revenue Insights: Eaton Corporation plc and Southwest Airlines Co. Performance Compared
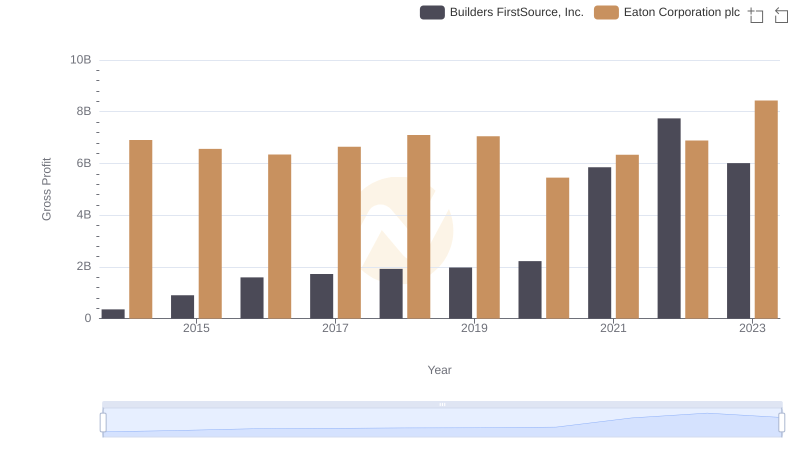
Eaton Corporation plc and Builders FirstSource, Inc.: A Detailed Gross Profit Analysis
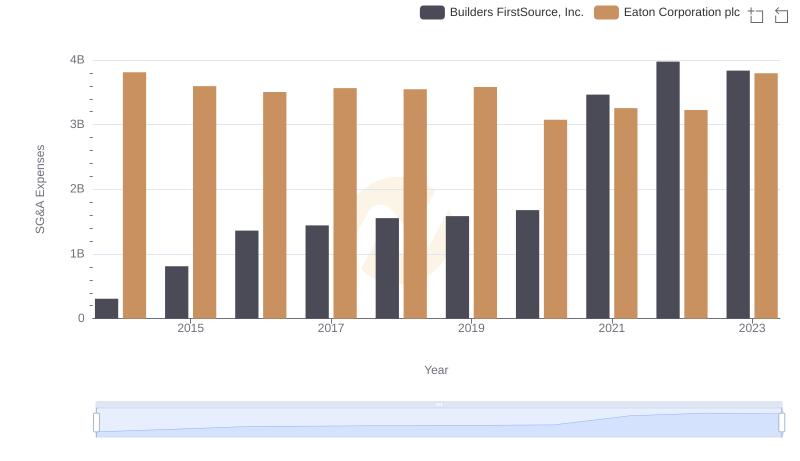
Cost Management Insights: SG&A Expenses for Eaton Corporation plc and Builders FirstSource, Inc.