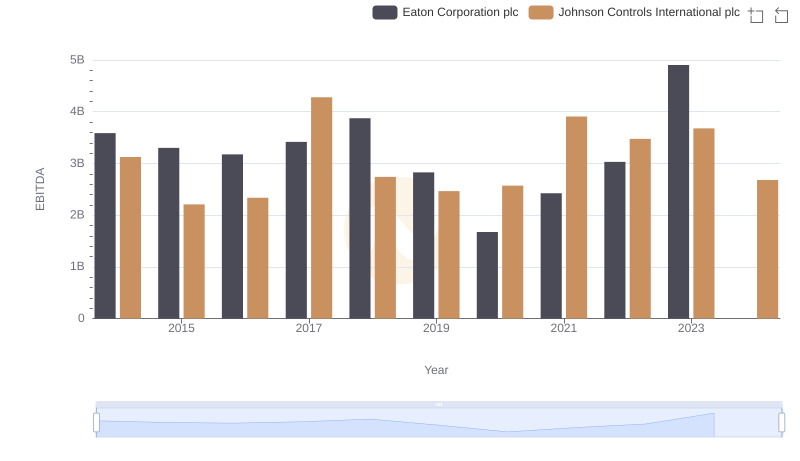
| __timestamp | Eaton Corporation plc | Johnson Controls International plc |
|---|---|---|
| Wednesday, January 1, 2014 | 6906000000 | 6627000000 |
| Thursday, January 1, 2015 | 6563000000 | 6447000000 |
| Friday, January 1, 2016 | 6347000000 | 5654000000 |
| Sunday, January 1, 2017 | 6648000000 | 9339000000 |
| Monday, January 1, 2018 | 7098000000 | 9380000000 |
| Tuesday, January 1, 2019 | 7052000000 | 7693000000 |
| Wednesday, January 1, 2020 | 5450000000 | 7411000000 |
| Friday, January 1, 2021 | 6335000000 | 8059000000 |
| Saturday, January 1, 2022 | 6887000000 | 8343000000 |
| Sunday, January 1, 2023 | 8433000000 | 8971000000 |
| Monday, January 1, 2024 | 9503000000 | 8077000000 |
Unleashing the power of data
In the competitive landscape of industrial giants, Eaton Corporation plc and Johnson Controls International plc have showcased intriguing gross profit trends over the past decade. From 2014 to 2023, Eaton's gross profit fluctuated, peaking in 2023 with a remarkable 22% increase from its lowest point in 2020. Meanwhile, Johnson Controls demonstrated a more consistent upward trajectory, achieving a 35% growth from 2016 to 2023.
Eaton's gross profit saw a dip in 2020, likely due to global economic challenges, but rebounded strongly by 2023. In contrast, Johnson Controls experienced a significant surge in 2017, maintaining a steady climb thereafter. Notably, 2024 data for Eaton is missing, leaving room for speculation on its future performance.
These trends highlight the resilience and strategic maneuvers of both corporations in navigating economic shifts and market demands.