| __timestamp | Eaton Corporation plc | Elbit Systems Ltd. |
|---|---|---|
| Wednesday, January 1, 2014 | 3586000000 | 358274000 |
| Thursday, January 1, 2015 | 3302000000 | 390932000 |
| Friday, January 1, 2016 | 3176000000 | 424003291 |
| Sunday, January 1, 2017 | 3418000000 | 438616108 |
| Monday, January 1, 2018 | 3875000000 | 374866620 |
| Tuesday, January 1, 2019 | 2827000000 | 502866000 |
| Wednesday, January 1, 2020 | 1674000000 | 484464000 |
| Friday, January 1, 2021 | 2423000000 | 576645646 |
| Saturday, January 1, 2022 | 3031000000 | 505269000 |
| Sunday, January 1, 2023 | 4904000000 | 544811000 |
| Monday, January 1, 2024 | 5547999771 |
Data in motion
In the competitive landscape of global corporations, understanding financial performance is crucial. This analysis focuses on the EBITDA trends of Eaton Corporation plc and Elbit Systems Ltd. from 2014 to 2023. Over this period, Eaton consistently outperformed Elbit, with an average EBITDA nearly seven times higher. Notably, Eaton's EBITDA peaked in 2023, marking a 46% increase from its lowest point in 2020, reflecting a robust recovery post-pandemic. Meanwhile, Elbit's EBITDA showed a steady growth, with a 52% rise from 2014 to 2023, highlighting its resilience in the defense sector. This comparison underscores Eaton's dominance in the industrial sector, while Elbit's steady growth showcases its strategic positioning in the defense industry. Such insights are invaluable for investors and analysts seeking to understand market dynamics and corporate strategies.
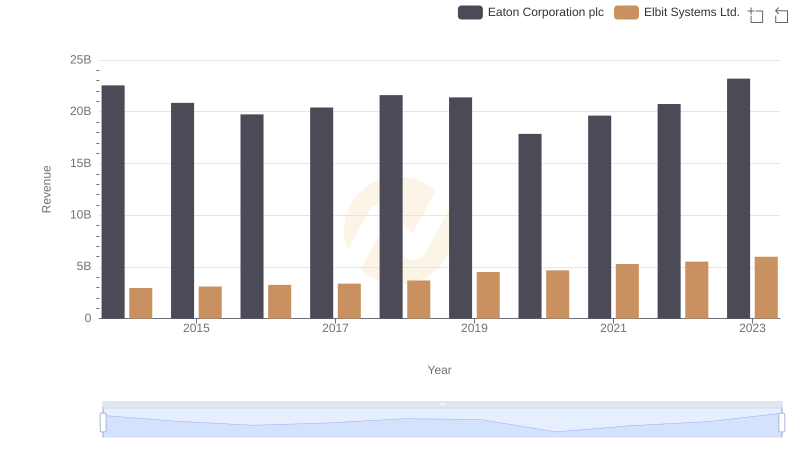
Eaton Corporation plc vs Elbit Systems Ltd.: Examining Key Revenue Metrics
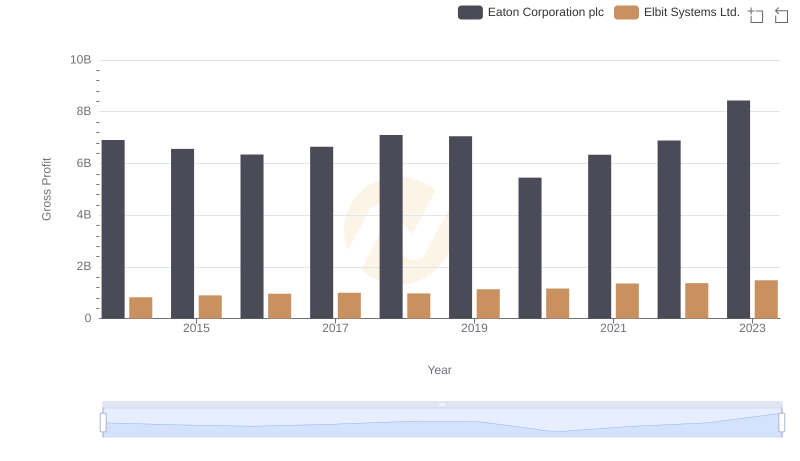
Key Insights on Gross Profit: Eaton Corporation plc vs Elbit Systems Ltd.
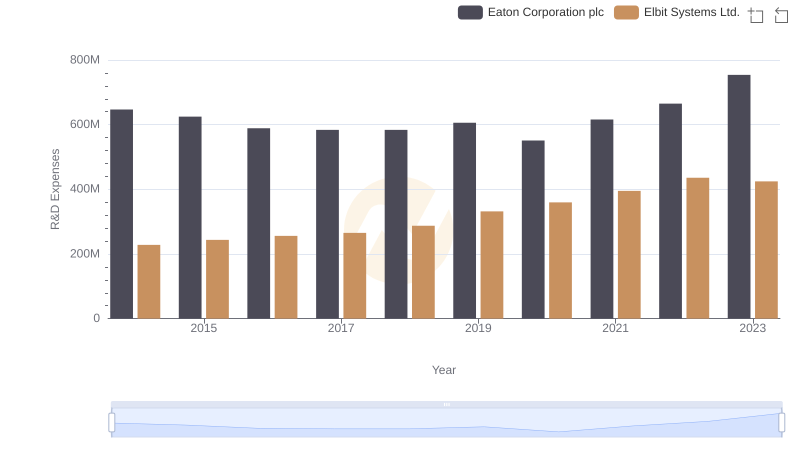
Research and Development Expenses Breakdown: Eaton Corporation plc vs Elbit Systems Ltd.
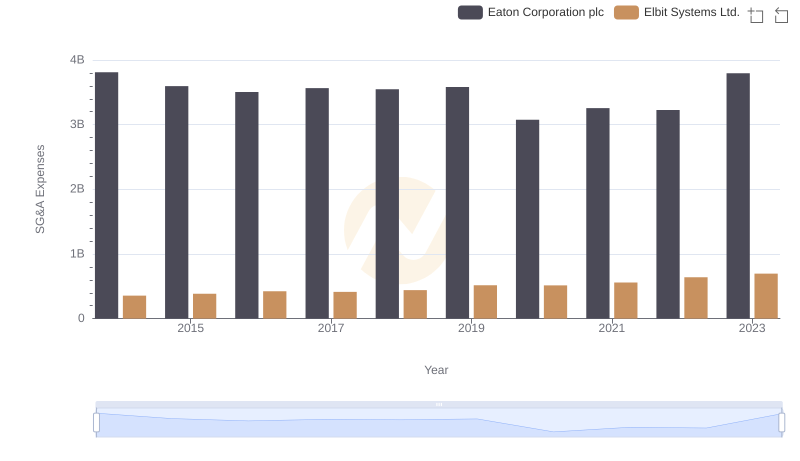
Comparing SG&A Expenses: Eaton Corporation plc vs Elbit Systems Ltd. Trends and Insights
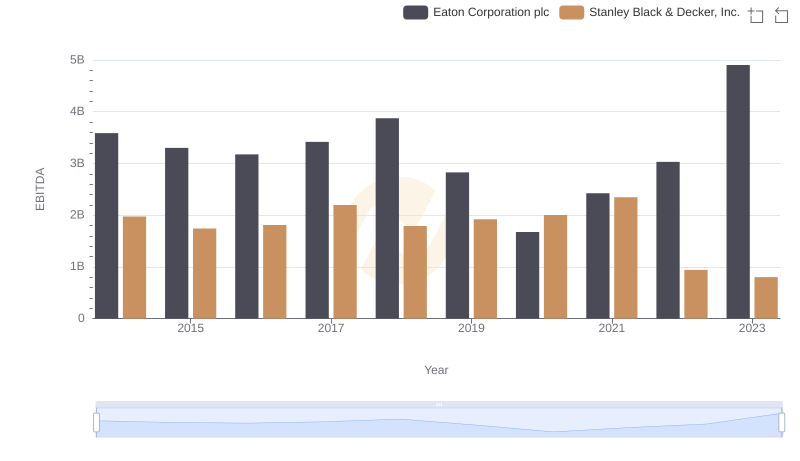
Eaton Corporation plc and Stanley Black & Decker, Inc.: A Detailed Examination of EBITDA Performance
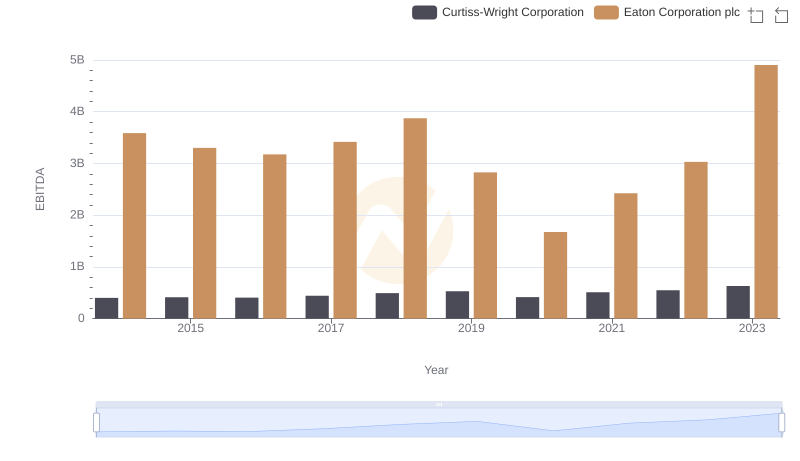
A Side-by-Side Analysis of EBITDA: Eaton Corporation plc and Curtiss-Wright Corporation
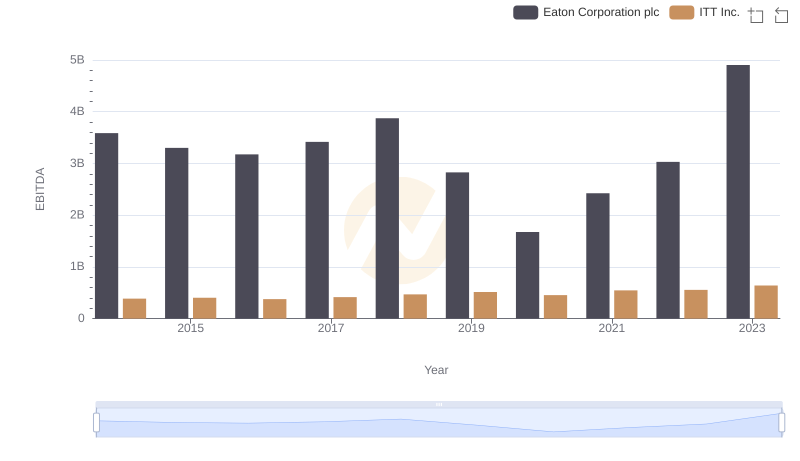
EBITDA Analysis: Evaluating Eaton Corporation plc Against ITT Inc.