| __timestamp | Curtiss-Wright Corporation | Eaton Corporation plc |
|---|---|---|
| Wednesday, January 1, 2014 | 401669000 | 3586000000 |
| Thursday, January 1, 2015 | 412042000 | 3302000000 |
| Friday, January 1, 2016 | 405217000 | 3176000000 |
| Sunday, January 1, 2017 | 441085000 | 3418000000 |
| Monday, January 1, 2018 | 493171000 | 3875000000 |
| Tuesday, January 1, 2019 | 530221000 | 2827000000 |
| Wednesday, January 1, 2020 | 414499000 | 1674000000 |
| Friday, January 1, 2021 | 509134000 | 2423000000 |
| Saturday, January 1, 2022 | 548202000 | 3031000000 |
| Sunday, January 1, 2023 | 630635000 | 4904000000 |
| Monday, January 1, 2024 | 674592000 | 5547999771 |
Unleashing insights
In the ever-evolving landscape of industrial manufacturing, Eaton Corporation plc and Curtiss-Wright Corporation stand as titans. Over the past decade, from 2014 to 2023, these companies have showcased remarkable financial trajectories. Eaton Corporation, with its diversified portfolio, has consistently outperformed Curtiss-Wright in terms of EBITDA, peaking at a staggering $4.9 billion in 2023. This represents a growth of approximately 37% from its 2014 figures. In contrast, Curtiss-Wright, while smaller in scale, has demonstrated steady growth, achieving a 57% increase in EBITDA over the same period, reaching $630 million in 2023. This side-by-side analysis highlights Eaton's robust market position and Curtiss-Wright's resilience and adaptability. As the industrial sector continues to innovate, these financial insights provide a glimpse into the strategic maneuvers of these industry leaders.
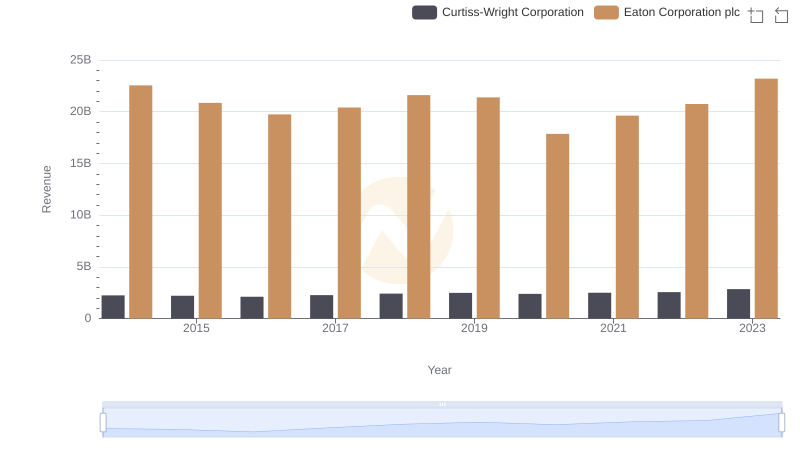
Eaton Corporation plc and Curtiss-Wright Corporation: A Comprehensive Revenue Analysis
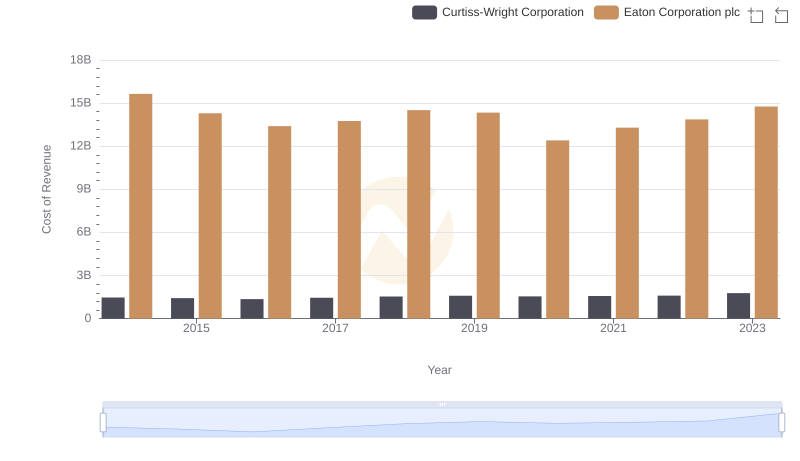
Cost of Revenue: Key Insights for Eaton Corporation plc and Curtiss-Wright Corporation
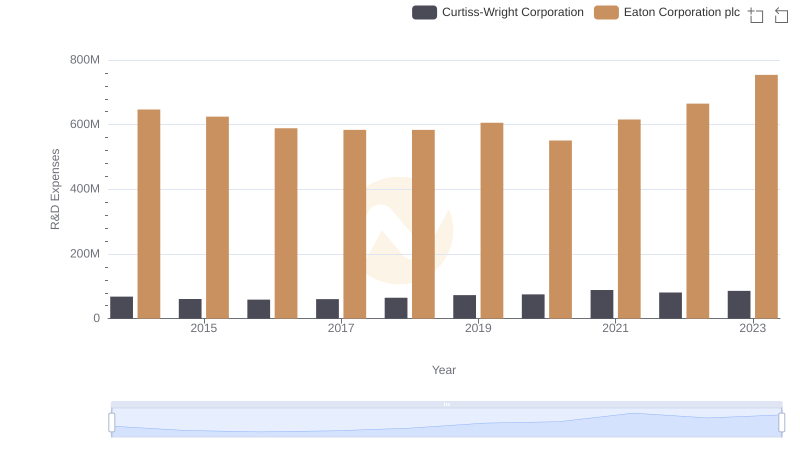
Eaton Corporation plc vs Curtiss-Wright Corporation: Strategic Focus on R&D Spending
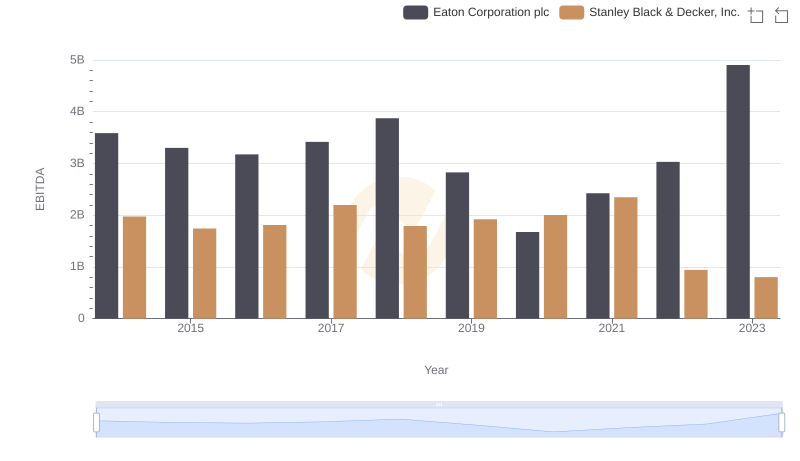
Eaton Corporation plc and Stanley Black & Decker, Inc.: A Detailed Examination of EBITDA Performance
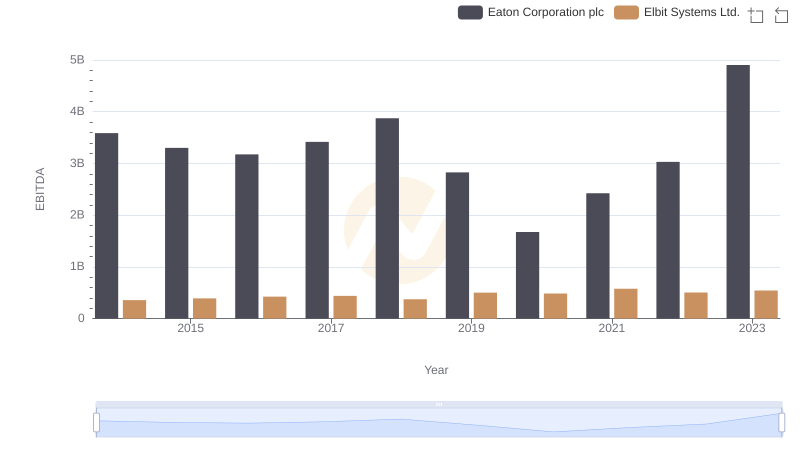
Professional EBITDA Benchmarking: Eaton Corporation plc vs Elbit Systems Ltd.
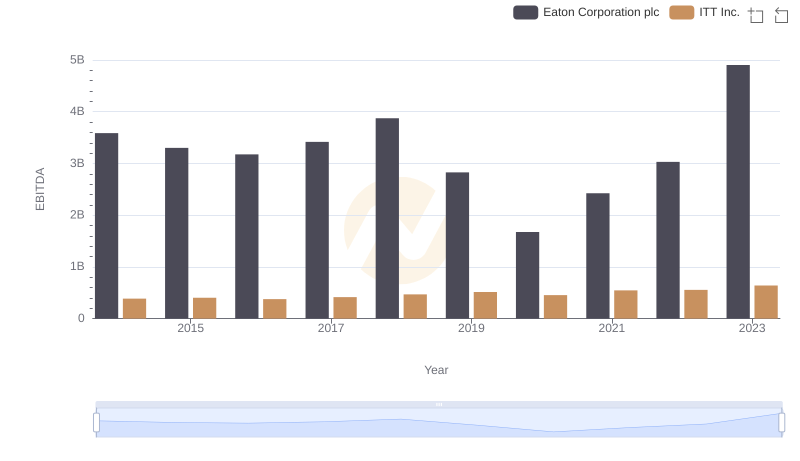
EBITDA Analysis: Evaluating Eaton Corporation plc Against ITT Inc.