| __timestamp | Eaton Corporation plc | ITT Inc. |
|---|---|---|
| Wednesday, January 1, 2014 | 3586000000 | 386700000 |
| Thursday, January 1, 2015 | 3302000000 | 402700000 |
| Friday, January 1, 2016 | 3176000000 | 378000000 |
| Sunday, January 1, 2017 | 3418000000 | 415000000 |
| Monday, January 1, 2018 | 3875000000 | 469000000 |
| Tuesday, January 1, 2019 | 2827000000 | 513900000 |
| Wednesday, January 1, 2020 | 1674000000 | 455000000 |
| Friday, January 1, 2021 | 2423000000 | 545600000 |
| Saturday, January 1, 2022 | 3031000000 | 554500000 |
| Sunday, January 1, 2023 | 4904000000 | 639100000 |
| Monday, January 1, 2024 | 5547999771 | 821500000 |
Unleashing insights
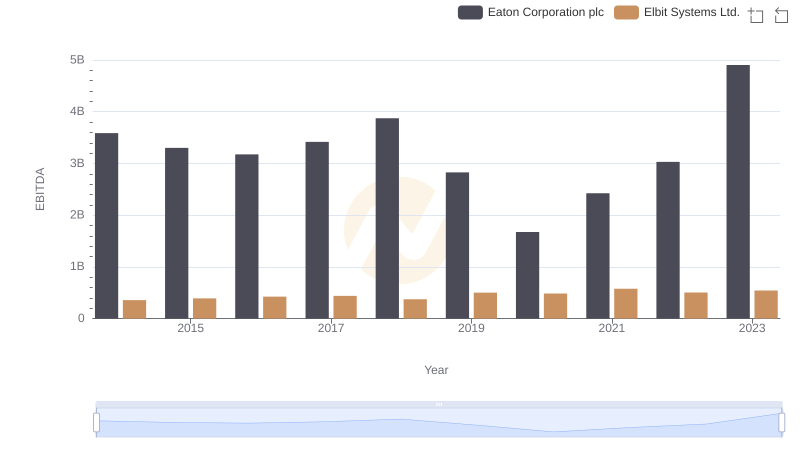
In the ever-evolving landscape of industrial manufacturing, Eaton Corporation plc and ITT Inc. have emerged as key players. Over the past decade, Eaton has consistently outperformed ITT in terms of EBITDA, a critical measure of a company's operating performance. From 2014 to 2023, Eaton's EBITDA grew by approximately 37%, peaking in 2023 with a remarkable 4.9 billion. In contrast, ITT's EBITDA increased by about 65% over the same period, reaching 639 million in 2023. This growth trajectory highlights ITT's impressive recovery and expansion efforts, despite its smaller scale compared to Eaton. The data reveals a significant dip for both companies in 2020, likely due to global economic disruptions, but both have shown resilience with a strong rebound in subsequent years. This analysis underscores the dynamic nature of the industrial sector and the strategic maneuvers by these corporations to maintain competitive advantage.
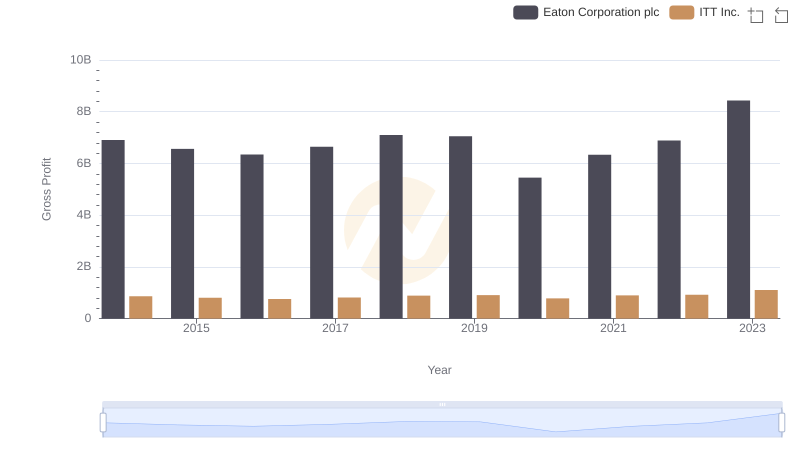
Gross Profit Analysis: Comparing Eaton Corporation plc and ITT Inc.
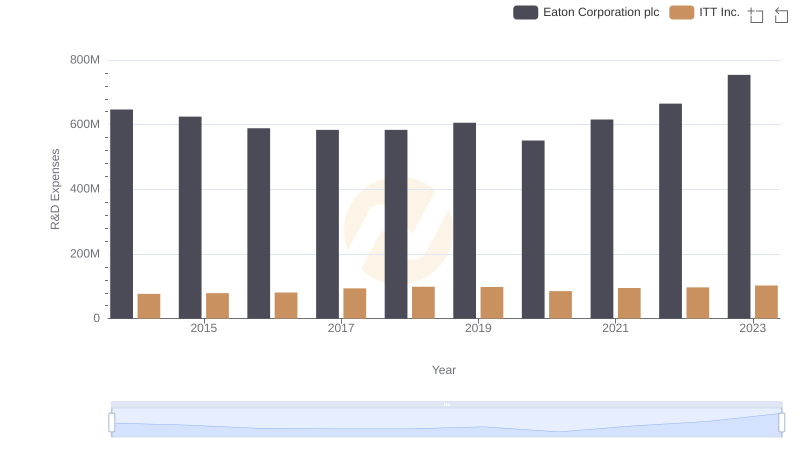
Comparing Innovation Spending: Eaton Corporation plc and ITT Inc.
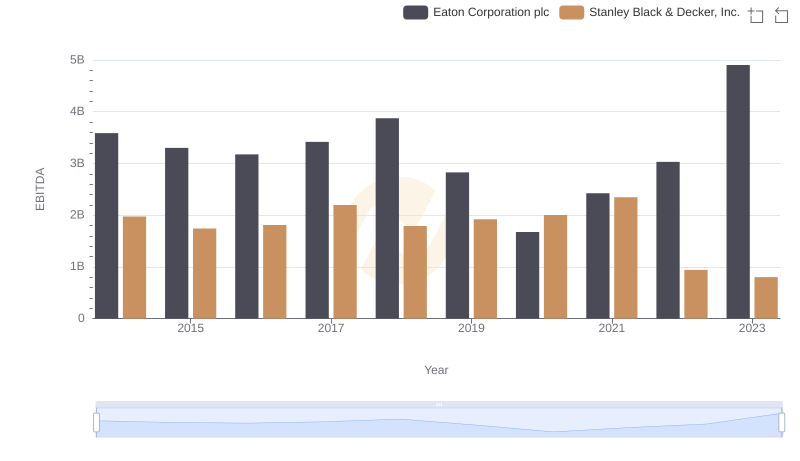
Eaton Corporation plc and Stanley Black & Decker, Inc.: A Detailed Examination of EBITDA Performance

Eaton Corporation plc and ITT Inc.: SG&A Spending Patterns Compared
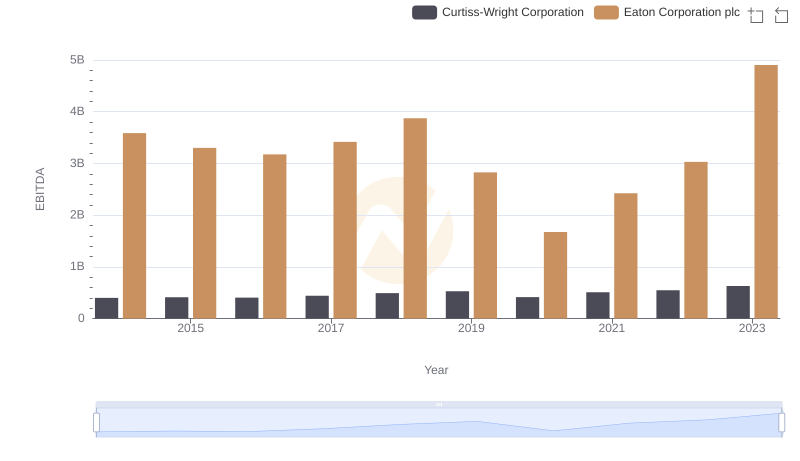
A Side-by-Side Analysis of EBITDA: Eaton Corporation plc and Curtiss-Wright Corporation
Professional EBITDA Benchmarking: Eaton Corporation plc vs Elbit Systems Ltd.