| __timestamp | Eaton Corporation plc | Elbit Systems Ltd. |
|---|---|---|
| Wednesday, January 1, 2014 | 22552000000 | 2958248000 |
| Thursday, January 1, 2015 | 20855000000 | 3107581000 |
| Friday, January 1, 2016 | 19747000000 | 3260219000 |
| Sunday, January 1, 2017 | 20404000000 | 3377825000 |
| Monday, January 1, 2018 | 21609000000 | 3683684000 |
| Tuesday, January 1, 2019 | 21390000000 | 4508400000 |
| Wednesday, January 1, 2020 | 17858000000 | 4662572000 |
| Friday, January 1, 2021 | 19628000000 | 5278521000 |
| Saturday, January 1, 2022 | 20752000000 | 5511549000 |
| Sunday, January 1, 2023 | 23196000000 | 5974744000 |
| Monday, January 1, 2024 | 24878000000 |
Unlocking the unknown
In the ever-evolving landscape of global industry, Eaton Corporation plc and Elbit Systems Ltd. stand as titans in their respective fields. Over the past decade, Eaton has consistently outpaced Elbit in revenue, boasting an average annual revenue of approximately $20.8 billion, nearly five times that of Elbit's $4.2 billion. However, Elbit's growth trajectory is noteworthy, with a 102% increase in revenue from 2014 to 2023, compared to Eaton's 3% growth.
This analysis underscores the dynamic nature of these industries, where strategic decisions and market conditions shape financial outcomes.
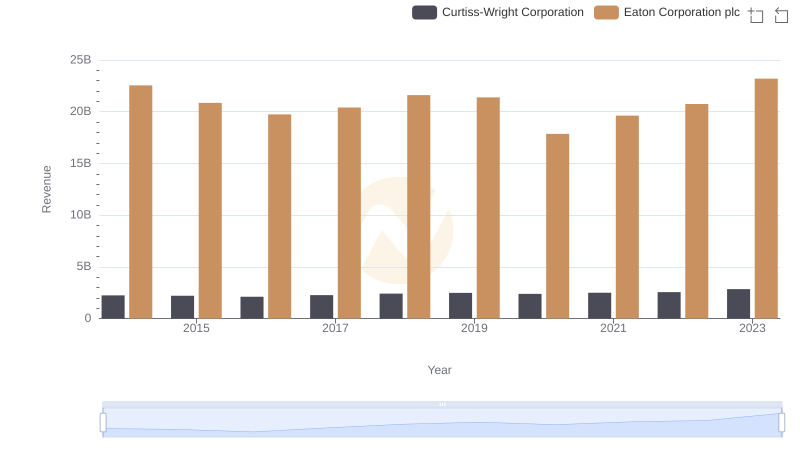
Eaton Corporation plc and Curtiss-Wright Corporation: A Comprehensive Revenue Analysis
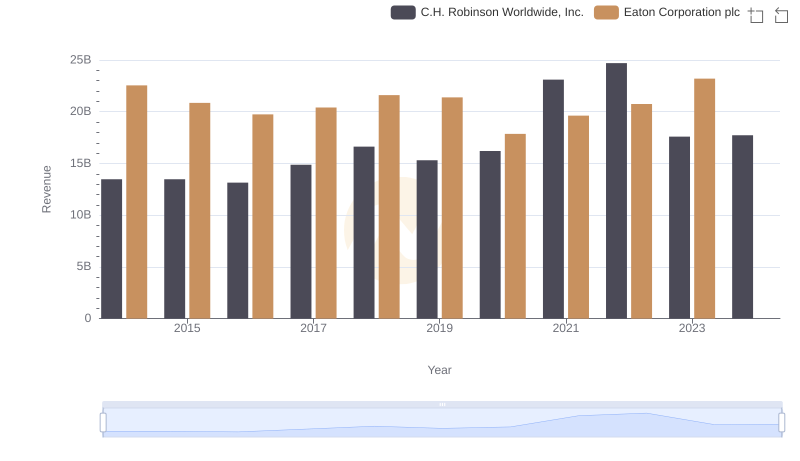
Breaking Down Revenue Trends: Eaton Corporation plc vs C.H. Robinson Worldwide, Inc.
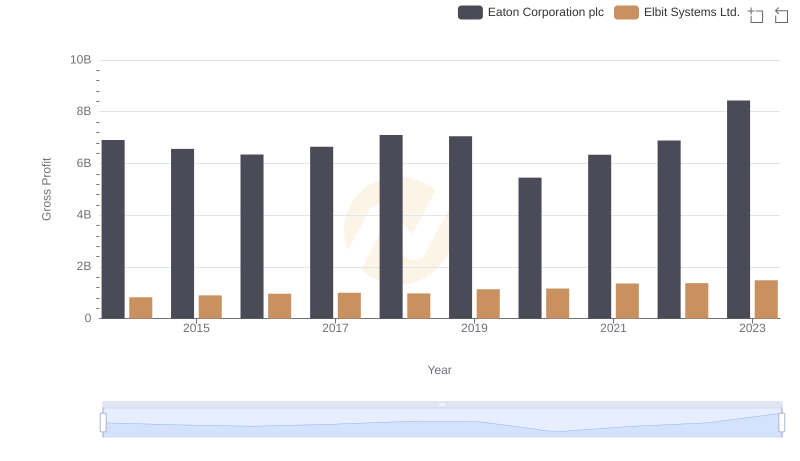
Key Insights on Gross Profit: Eaton Corporation plc vs Elbit Systems Ltd.
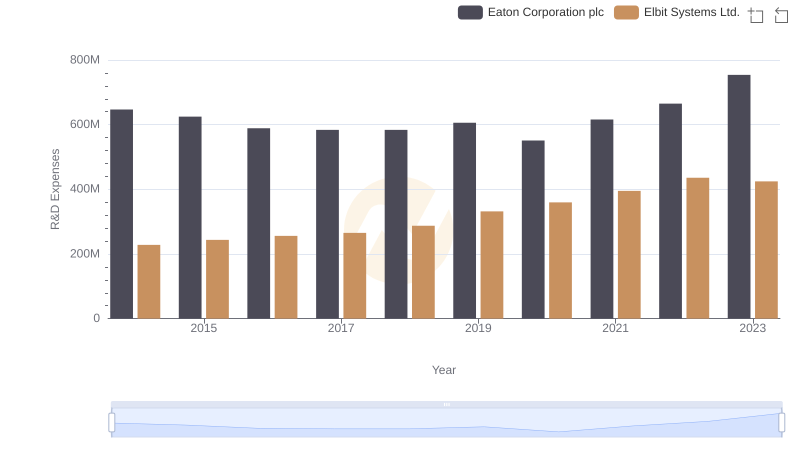
Research and Development Expenses Breakdown: Eaton Corporation plc vs Elbit Systems Ltd.
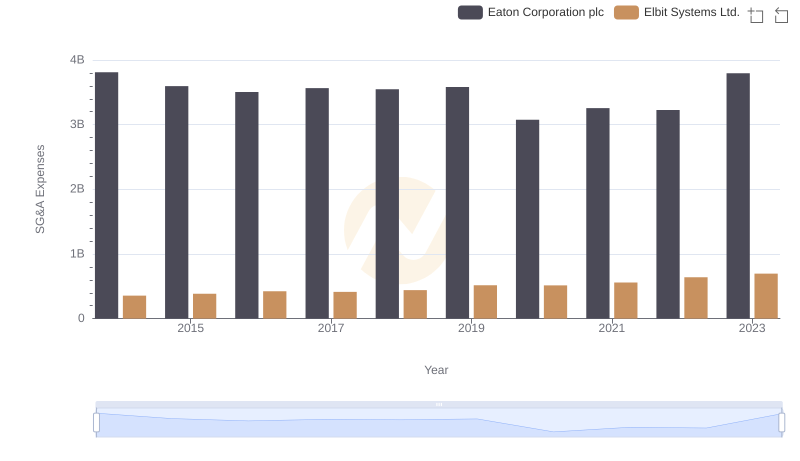
Comparing SG&A Expenses: Eaton Corporation plc vs Elbit Systems Ltd. Trends and Insights
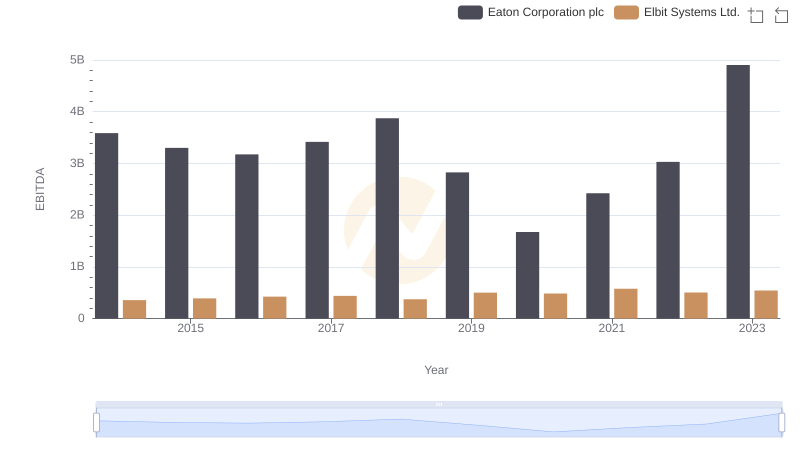
Professional EBITDA Benchmarking: Eaton Corporation plc vs Elbit Systems Ltd.