| __timestamp | Allegion plc | Eaton Corporation plc |
|---|---|---|
| Wednesday, January 1, 2014 | 365700000 | 3586000000 |
| Thursday, January 1, 2015 | 315400000 | 3302000000 |
| Friday, January 1, 2016 | 422600000 | 3176000000 |
| Sunday, January 1, 2017 | 523300000 | 3418000000 |
| Monday, January 1, 2018 | 617600000 | 3875000000 |
| Tuesday, January 1, 2019 | 614300000 | 2827000000 |
| Wednesday, January 1, 2020 | 497700000 | 1674000000 |
| Friday, January 1, 2021 | 657300000 | 2423000000 |
| Saturday, January 1, 2022 | 688300000 | 3031000000 |
| Sunday, January 1, 2023 | 819300000 | 4904000000 |
| Monday, January 1, 2024 | 919800000 | 5547999771 |
Unleashing the power of data
In the competitive landscape of industrial manufacturing, Eaton Corporation plc and Allegion plc stand as titans. Over the past decade, Eaton has consistently outperformed Allegion in terms of EBITDA, showcasing a robust financial health. From 2014 to 2023, Eaton's EBITDA surged by approximately 37%, peaking in 2023 with a remarkable $4.9 billion. In contrast, Allegion, while smaller in scale, demonstrated a steady growth trajectory, with its EBITDA increasing by about 124% over the same period, reaching $819 million in 2023. This growth highlights Allegion's strategic agility and market adaptability. The data underscores Eaton's dominance, yet Allegion's impressive growth rate signals a potential shift in the competitive dynamics. As the industrial sector evolves, these financial metrics provide a window into the strategic maneuvers of these industry leaders.
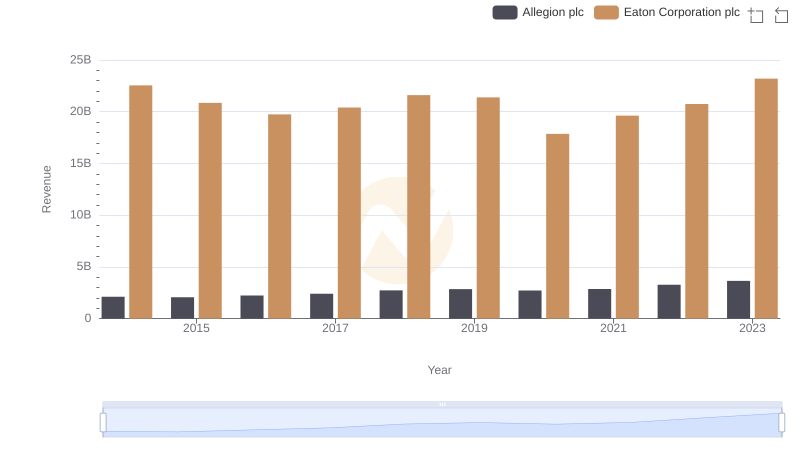
Breaking Down Revenue Trends: Eaton Corporation plc vs Allegion plc
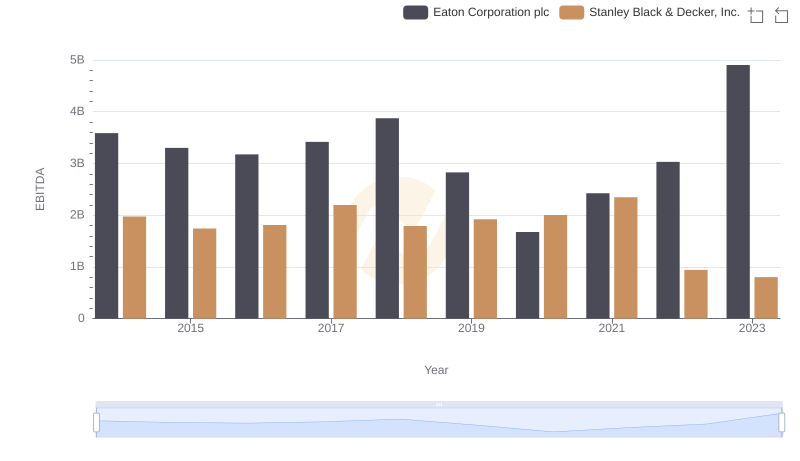
Eaton Corporation plc and Stanley Black & Decker, Inc.: A Detailed Examination of EBITDA Performance
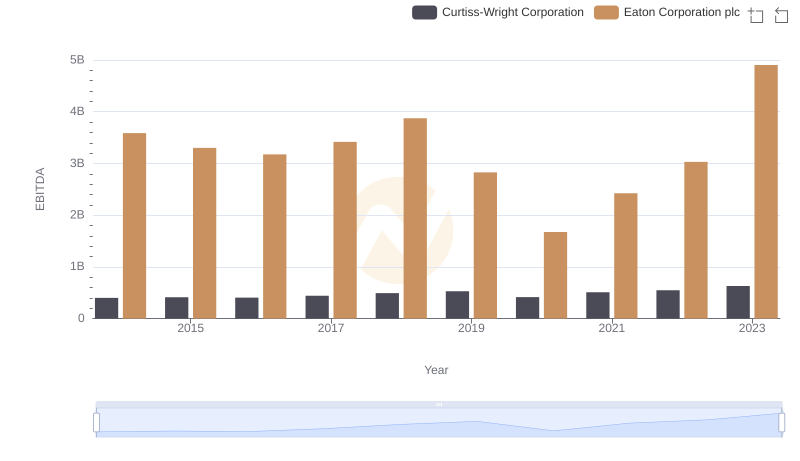
A Side-by-Side Analysis of EBITDA: Eaton Corporation plc and Curtiss-Wright Corporation
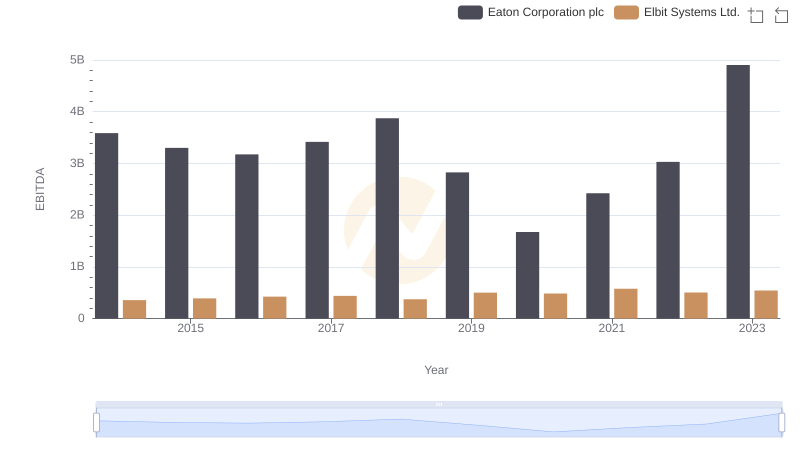
Professional EBITDA Benchmarking: Eaton Corporation plc vs Elbit Systems Ltd.
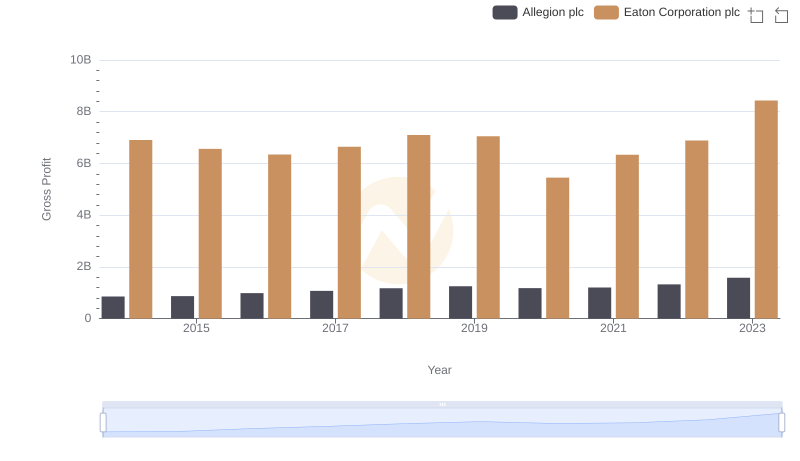
Key Insights on Gross Profit: Eaton Corporation plc vs Allegion plc
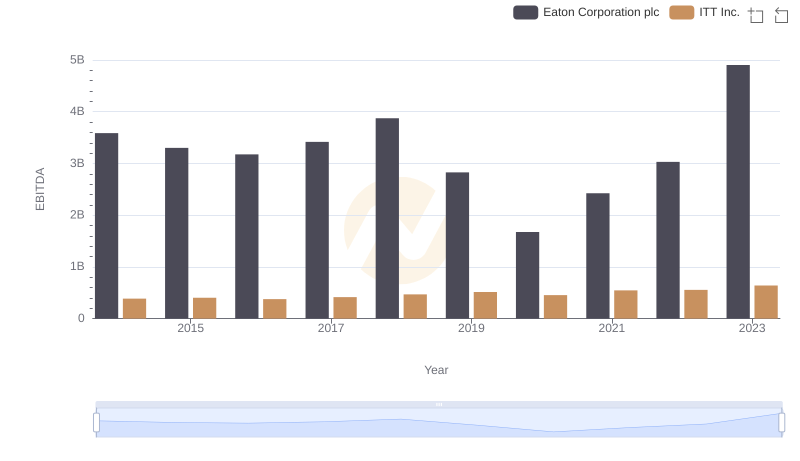
EBITDA Analysis: Evaluating Eaton Corporation plc Against ITT Inc.
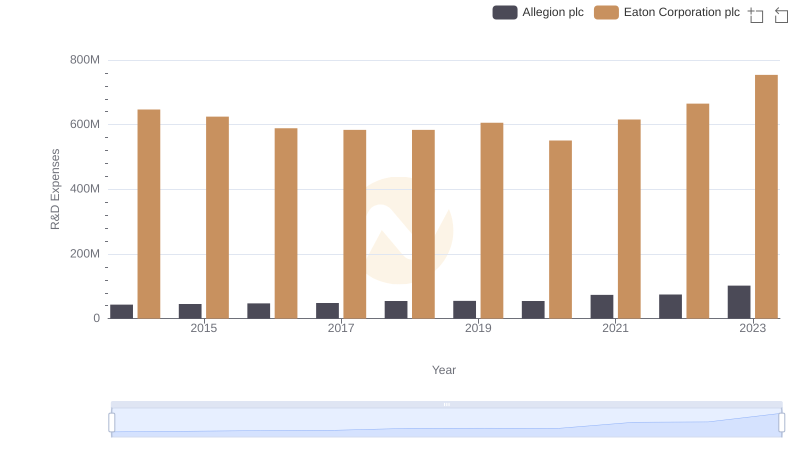
Eaton Corporation plc vs Allegion plc: Strategic Focus on R&D Spending