| __timestamp | Allegion plc | Eaton Corporation plc |
|---|---|---|
| Wednesday, January 1, 2014 | 2118300000 | 22552000000 |
| Thursday, January 1, 2015 | 2068100000 | 20855000000 |
| Friday, January 1, 2016 | 2238000000 | 19747000000 |
| Sunday, January 1, 2017 | 2408200000 | 20404000000 |
| Monday, January 1, 2018 | 2731700000 | 21609000000 |
| Tuesday, January 1, 2019 | 2854000000 | 21390000000 |
| Wednesday, January 1, 2020 | 2719900000 | 17858000000 |
| Friday, January 1, 2021 | 2867400000 | 19628000000 |
| Saturday, January 1, 2022 | 3271900000 | 20752000000 |
| Sunday, January 1, 2023 | 3650800000 | 23196000000 |
| Monday, January 1, 2024 | 3772200000 | 24878000000 |
Unlocking the unknown
In the competitive landscape of industrial manufacturing, Eaton Corporation plc and Allegion plc have showcased distinct revenue trajectories over the past decade. From 2014 to 2023, Eaton Corporation plc consistently outperformed Allegion plc, with revenues peaking at approximately $23.2 billion in 2023, marking a 30% increase from its 2020 low. Allegion plc, while smaller in scale, demonstrated a robust growth pattern, achieving a 72% revenue increase from 2014 to 2023, reaching around $3.65 billion. This period highlights Eaton's resilience and Allegion's dynamic growth, reflecting broader industry trends and strategic business maneuvers. As the industrial sector evolves, these companies exemplify the diverse strategies employed to navigate economic challenges and capitalize on emerging opportunities.
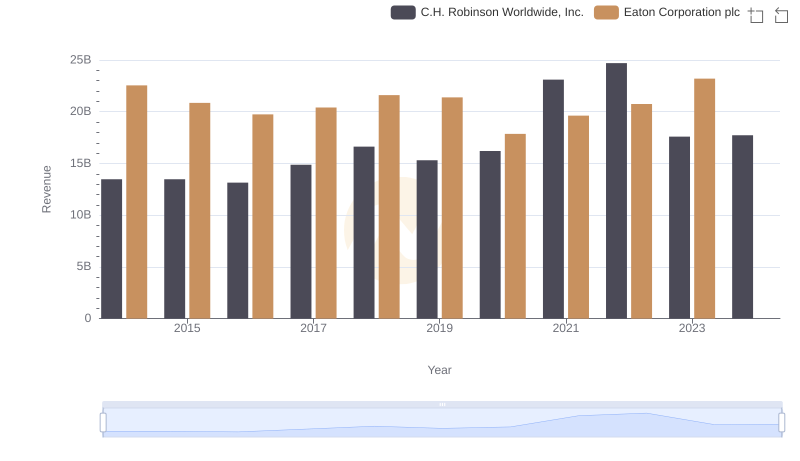
Breaking Down Revenue Trends: Eaton Corporation plc vs C.H. Robinson Worldwide, Inc.
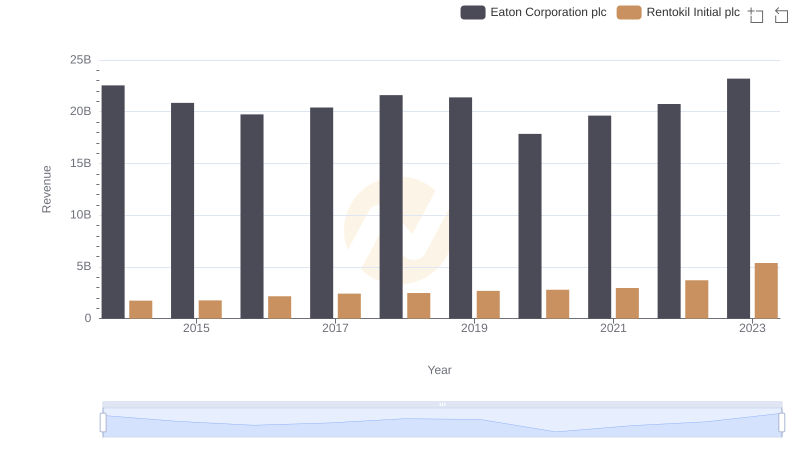
Eaton Corporation plc vs Rentokil Initial plc: Examining Key Revenue Metrics
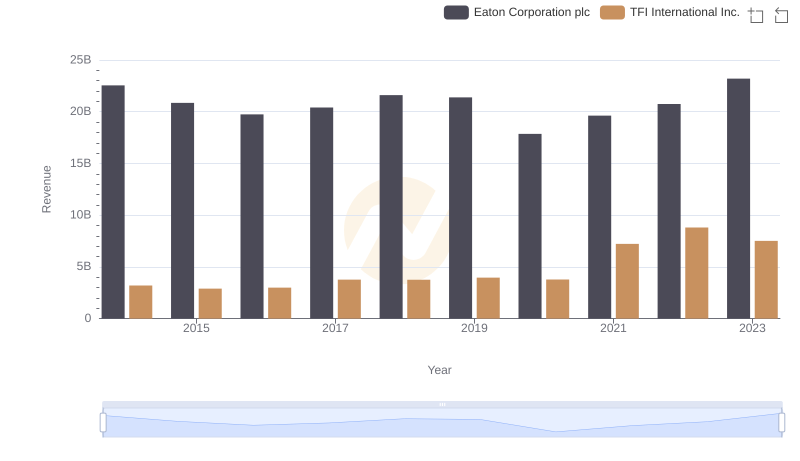
Eaton Corporation plc or TFI International Inc.: Who Leads in Yearly Revenue?
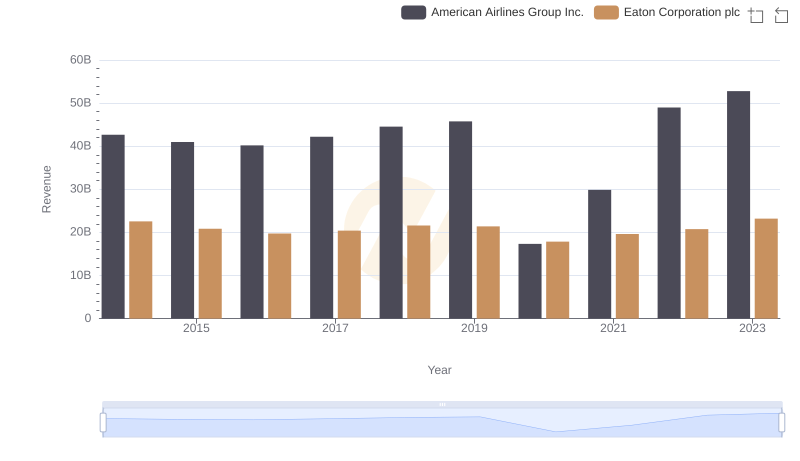
Comparing Revenue Performance: Eaton Corporation plc or American Airlines Group Inc.?
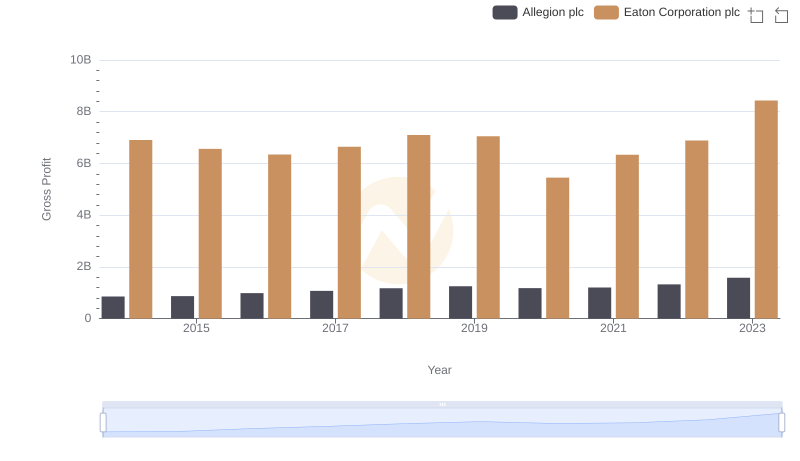
Key Insights on Gross Profit: Eaton Corporation plc vs Allegion plc
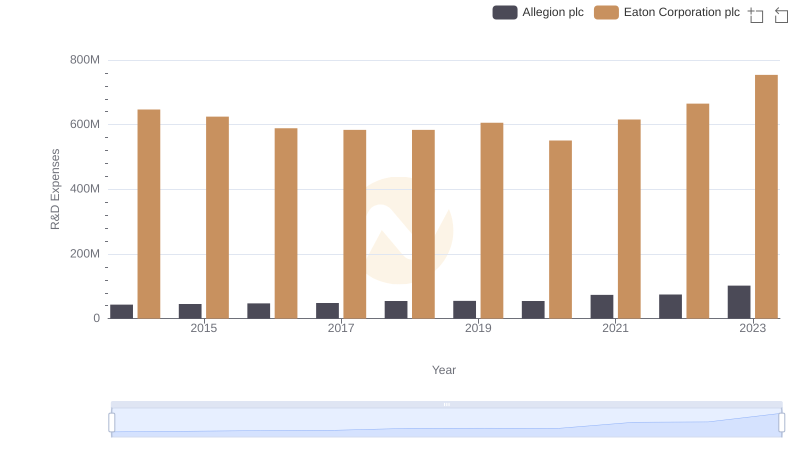
Eaton Corporation plc vs Allegion plc: Strategic Focus on R&D Spending
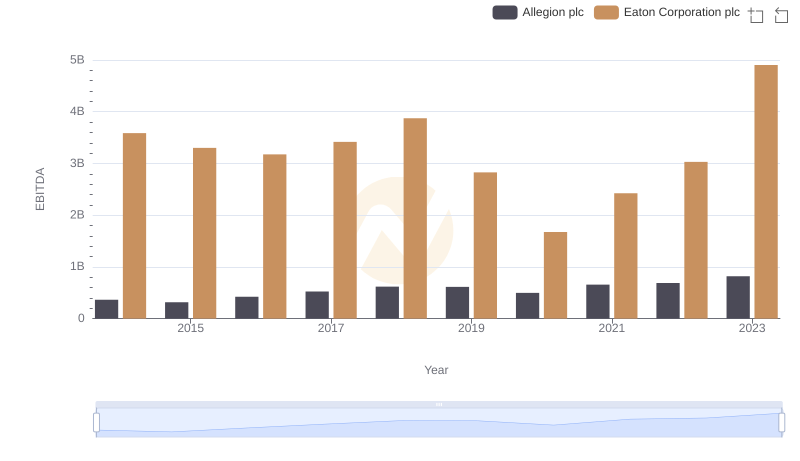
Professional EBITDA Benchmarking: Eaton Corporation plc vs Allegion plc