| __timestamp | Waste Connections, Inc. | Watsco, Inc. |
|---|---|---|
| Wednesday, January 1, 2014 | 229474000 | 650655000 |
| Thursday, January 1, 2015 | 237484000 | 670609000 |
| Friday, January 1, 2016 | 474263000 | 688952000 |
| Sunday, January 1, 2017 | 509638000 | 715671000 |
| Monday, January 1, 2018 | 524388000 | 757452000 |
| Tuesday, January 1, 2019 | 546278000 | 800328000 |
| Wednesday, January 1, 2020 | 537632000 | 833051000 |
| Friday, January 1, 2021 | 612337000 | 1058316000 |
| Saturday, January 1, 2022 | 696467000 | 1221382000 |
| Sunday, January 1, 2023 | 799119000 | 1185626000 |
| Monday, January 1, 2024 | 883445000 | 1262938000 |
Unleashing insights
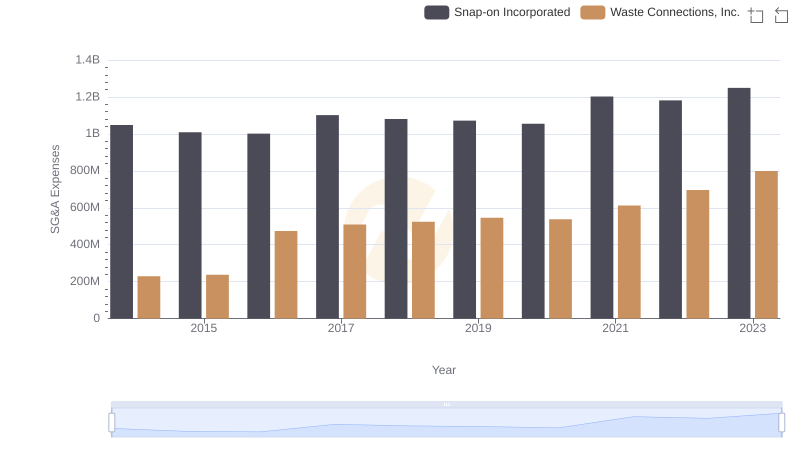
In the world of corporate finance, Selling, General, and Administrative (SG&A) expenses are a critical measure of a company's operational efficiency. Waste Connections, Inc. and Watsco, Inc. have shown intriguing trends in their SG&A expenses from 2014 to 2023. Waste Connections, Inc. has seen a steady increase, with expenses growing by approximately 248% over the decade. In contrast, Watsco, Inc. experienced a more moderate rise of about 82%. Notably, in 2021, Watsco's SG&A expenses surged past the billion-dollar mark, highlighting a significant operational expansion. Meanwhile, Waste Connections, Inc. reached its peak in 2023, with expenses nearing 800 million. These trends reflect strategic decisions and market conditions impacting each company's financial landscape. As investors and analysts delve into these figures, understanding the nuances of SG&A expenses can provide valuable insights into a company's growth trajectory and operational strategy.
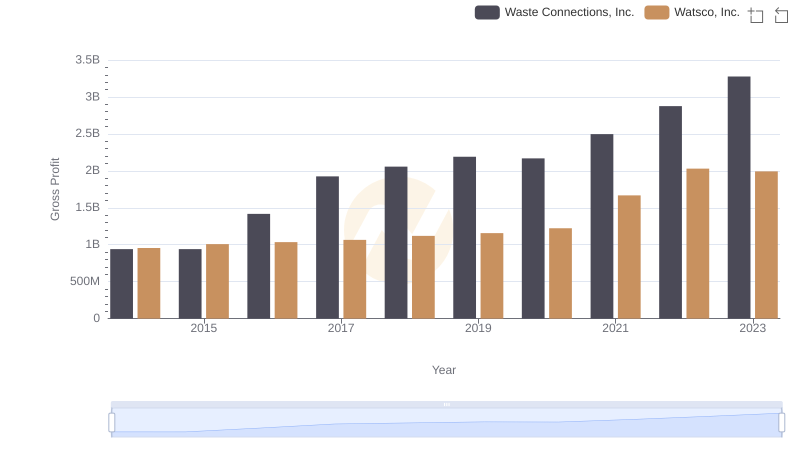
Gross Profit Comparison: Waste Connections, Inc. and Watsco, Inc. Trends
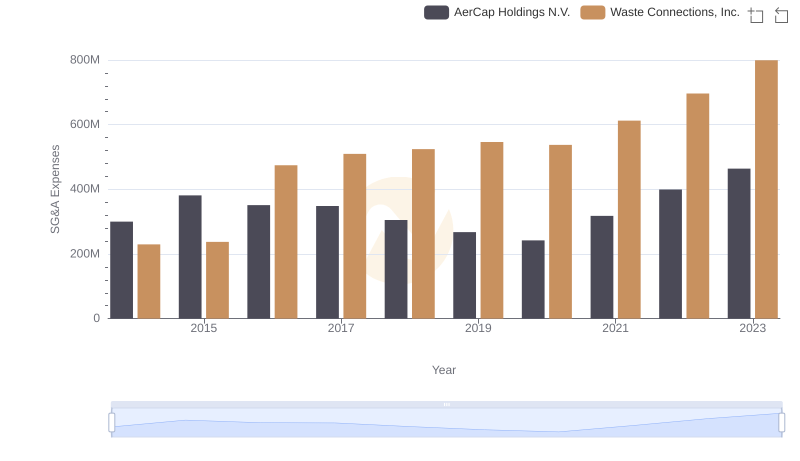
SG&A Efficiency Analysis: Comparing Waste Connections, Inc. and AerCap Holdings N.V.
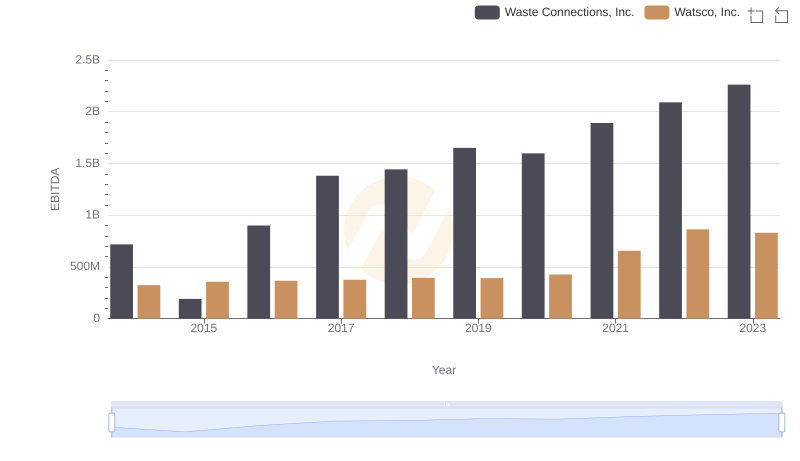
EBITDA Analysis: Evaluating Waste Connections, Inc. Against Watsco, Inc.
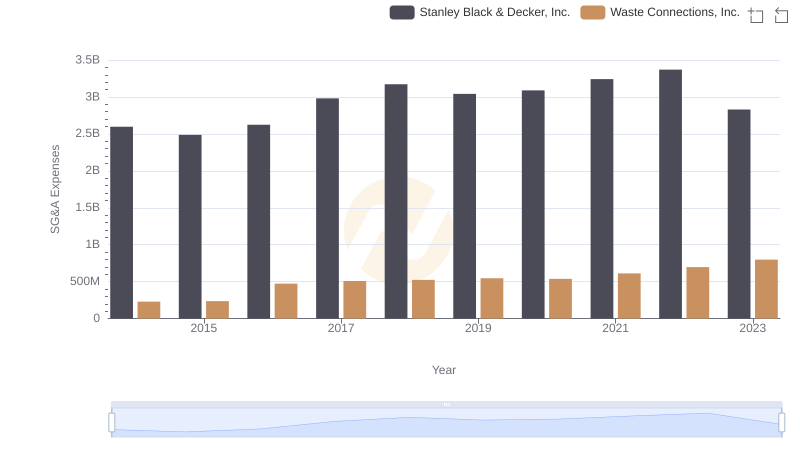
Breaking Down SG&A Expenses: Waste Connections, Inc. vs Stanley Black & Decker, Inc.
Operational Costs Compared: SG&A Analysis of Waste Connections, Inc. and Snap-on Incorporated