| __timestamp | Avery Dennison Corporation | Ingersoll Rand Inc. |
|---|---|---|
| Wednesday, January 1, 2014 | 1155300000 | 476000000 |
| Thursday, January 1, 2015 | 1108100000 | 427000000 |
| Friday, January 1, 2016 | 1097500000 | 414339000 |
| Sunday, January 1, 2017 | 1123200000 | 446600000 |
| Monday, January 1, 2018 | 1127500000 | 434600000 |
| Tuesday, January 1, 2019 | 1080400000 | 436400000 |
| Wednesday, January 1, 2020 | 1060500000 | 894800000 |
| Friday, January 1, 2021 | 1248500000 | 1028000000 |
| Saturday, January 1, 2022 | 1330800000 | 1095800000 |
| Sunday, January 1, 2023 | 1177900000 | 1272700000 |
| Monday, January 1, 2024 | 1415300000 | 0 |
Unveiling the hidden dimensions of data
In the ever-evolving landscape of industrial and manufacturing sectors, operational efficiency is paramount. This analysis delves into the Selling, General, and Administrative (SG&A) expenses of two industry giants: Ingersoll Rand Inc. and Avery Dennison Corporation, from 2014 to 2023. Over this period, Avery Dennison consistently maintained higher SG&A expenses, peaking in 2022 with a 15% increase from 2014. In contrast, Ingersoll Rand's SG&A expenses surged by over 160% from 2019 to 2023, reflecting strategic shifts and potential expansion efforts. Notably, 2023 marked a pivotal year where Ingersoll Rand's expenses surpassed Avery Dennison's for the first time, indicating a significant operational transformation. This trend underscores the dynamic nature of corporate strategies in response to market demands and economic conditions. As these companies navigate the complexities of global markets, their SG&A trends offer valuable insights into their operational priorities and financial health.
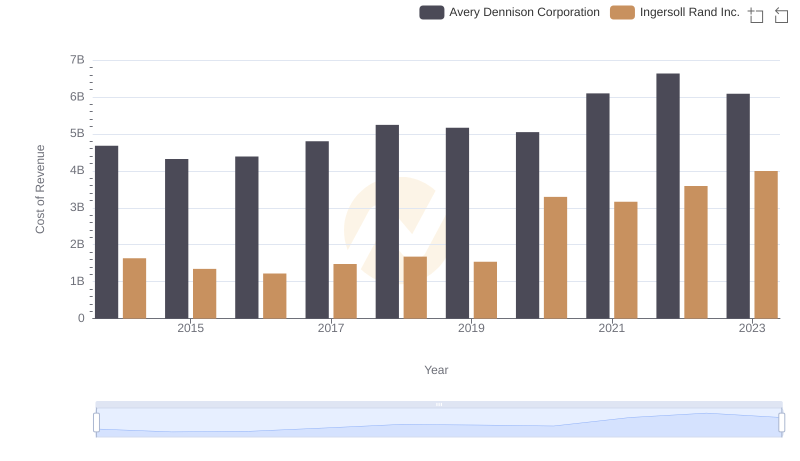
Analyzing Cost of Revenue: Ingersoll Rand Inc. and Avery Dennison Corporation
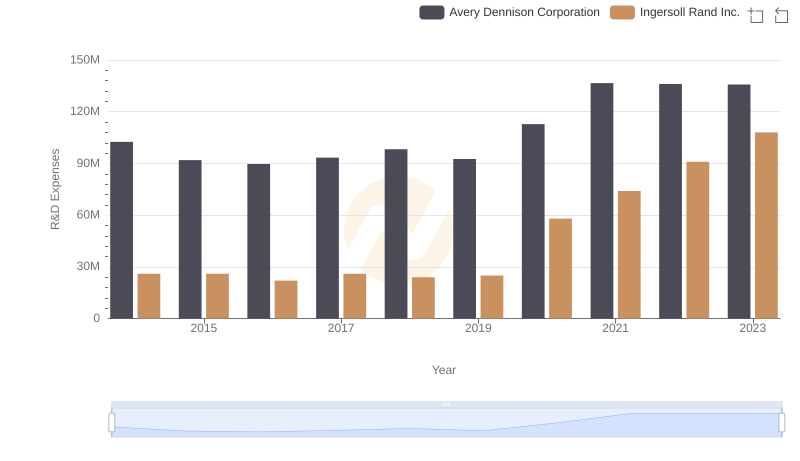
Research and Development Investment: Ingersoll Rand Inc. vs Avery Dennison Corporation
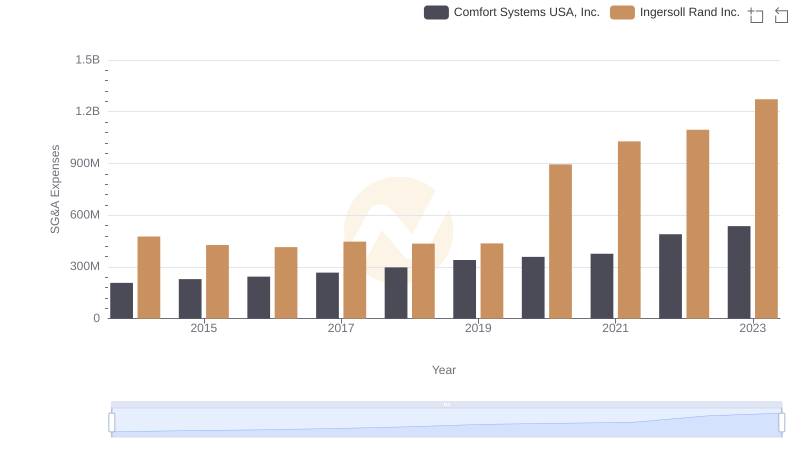
Cost Management Insights: SG&A Expenses for Ingersoll Rand Inc. and Comfort Systems USA, Inc.
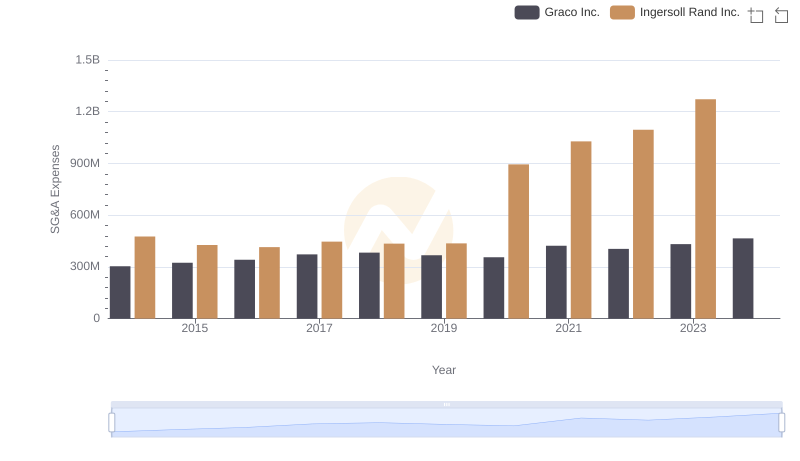
Ingersoll Rand Inc. vs Graco Inc.: SG&A Expense Trends
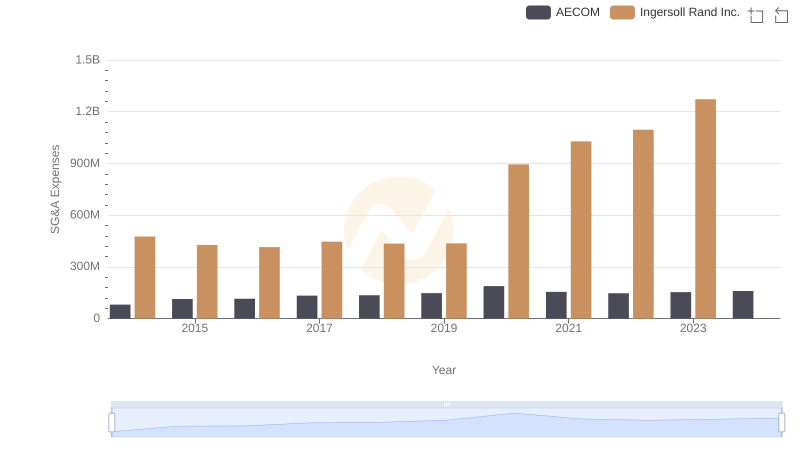
Ingersoll Rand Inc. or AECOM: Who Manages SG&A Costs Better?
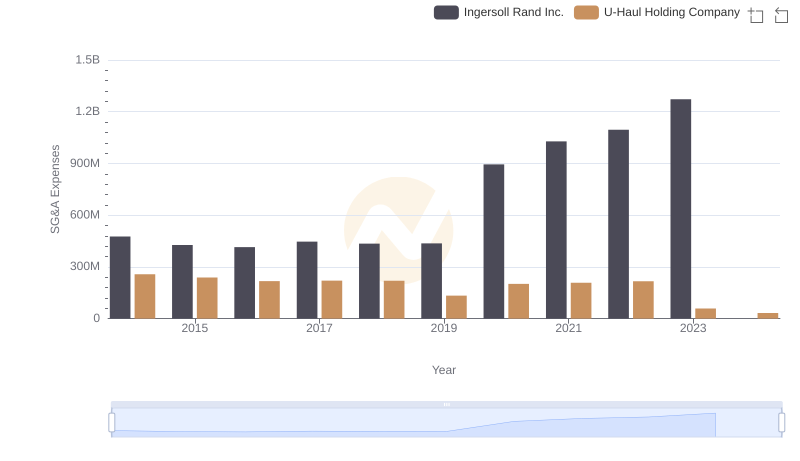
SG&A Efficiency Analysis: Comparing Ingersoll Rand Inc. and U-Haul Holding Company
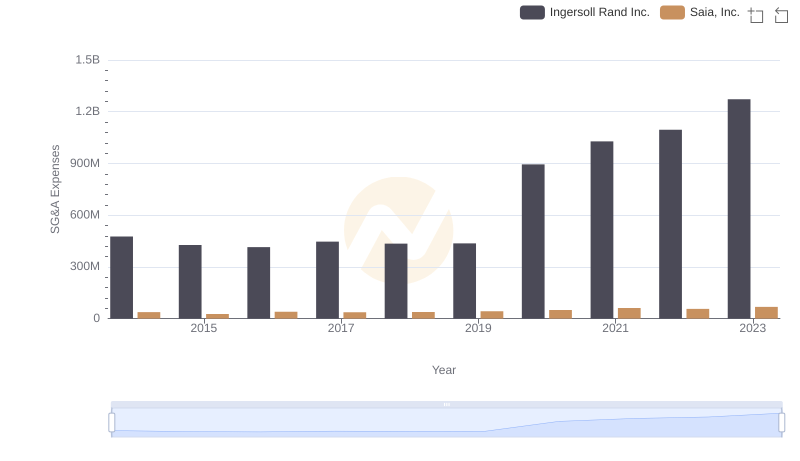
SG&A Efficiency Analysis: Comparing Ingersoll Rand Inc. and Saia, Inc.