| __timestamp | Graco Inc. | Ingersoll Rand Inc. |
|---|---|---|
| Wednesday, January 1, 2014 | 303565000 | 476000000 |
| Thursday, January 1, 2015 | 324016000 | 427000000 |
| Friday, January 1, 2016 | 341734000 | 414339000 |
| Sunday, January 1, 2017 | 372496000 | 446600000 |
| Monday, January 1, 2018 | 382988000 | 434600000 |
| Tuesday, January 1, 2019 | 367743000 | 436400000 |
| Wednesday, January 1, 2020 | 355796000 | 894800000 |
| Friday, January 1, 2021 | 422975000 | 1028000000 |
| Saturday, January 1, 2022 | 404731000 | 1095800000 |
| Sunday, January 1, 2023 | 432156000 | 1272700000 |
| Monday, January 1, 2024 | 465133000 | 0 |
Infusing magic into the data realm
In the competitive landscape of industrial manufacturing, understanding the financial strategies of key players is crucial. This analysis delves into the Selling, General, and Administrative (SG&A) expenses of Ingersoll Rand Inc. and Graco Inc. from 2014 to 2023. Over this period, Graco Inc. maintained a steady increase in SG&A expenses, peaking at approximately 46% higher in 2023 compared to 2014. Ingersoll Rand Inc., however, exhibited a more dramatic rise, with expenses surging by over 167% during the same timeframe. Notably, the year 2020 marked a significant leap for Ingersoll Rand, with expenses nearly doubling, reflecting strategic investments or restructuring efforts. While Graco's expenses show consistent growth, Ingersoll Rand's fluctuations suggest a more dynamic approach to managing operational costs. This financial insight offers a glimpse into the strategic priorities of these industrial giants, highlighting their differing approaches to growth and efficiency.
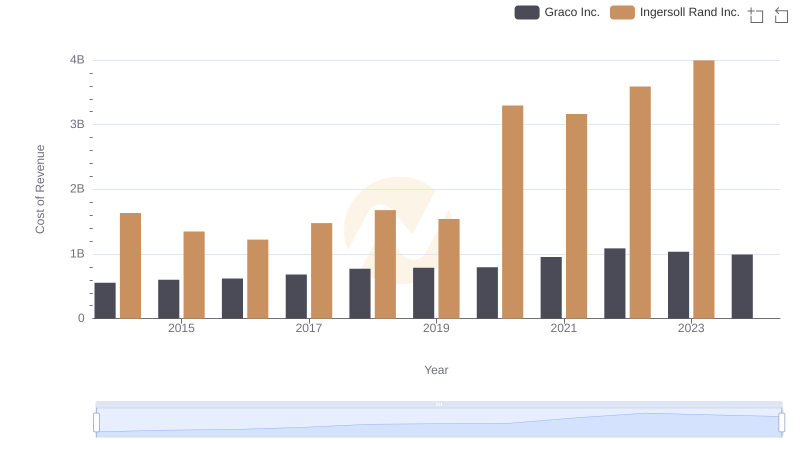
Cost of Revenue Comparison: Ingersoll Rand Inc. vs Graco Inc.
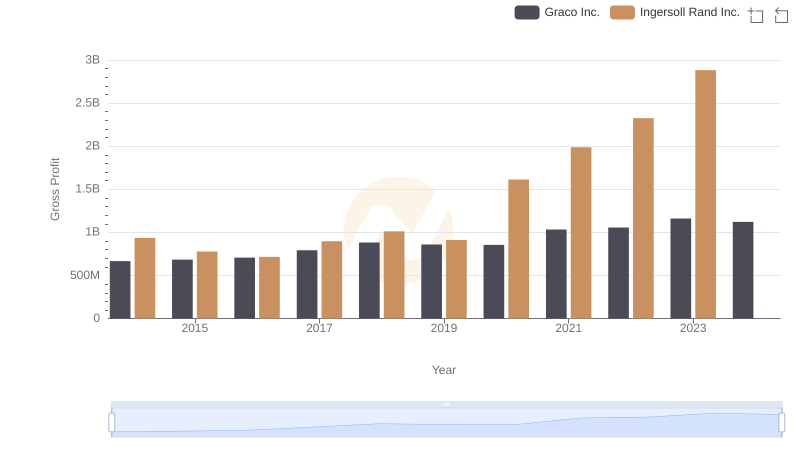
Gross Profit Trends Compared: Ingersoll Rand Inc. vs Graco Inc.
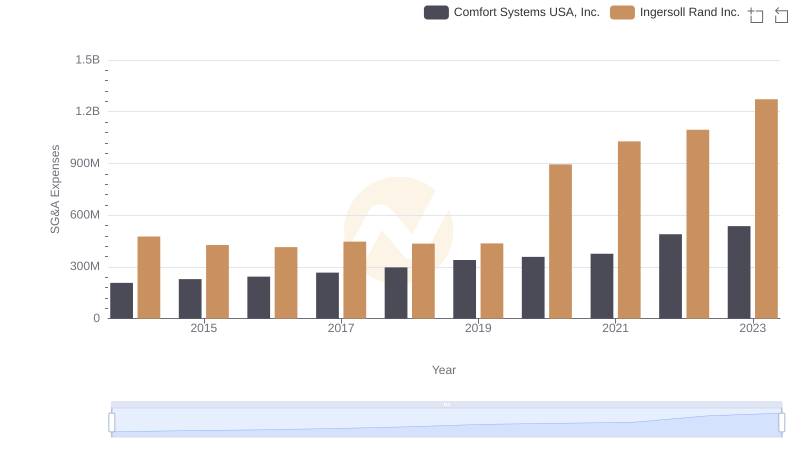
Cost Management Insights: SG&A Expenses for Ingersoll Rand Inc. and Comfort Systems USA, Inc.
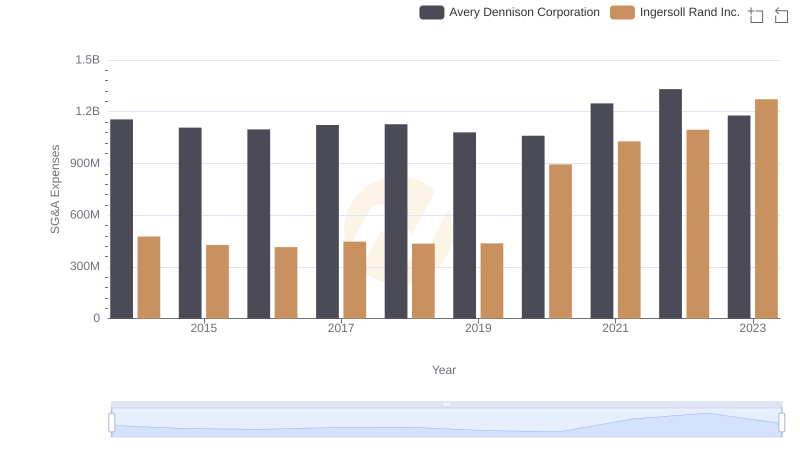
Operational Costs Compared: SG&A Analysis of Ingersoll Rand Inc. and Avery Dennison Corporation
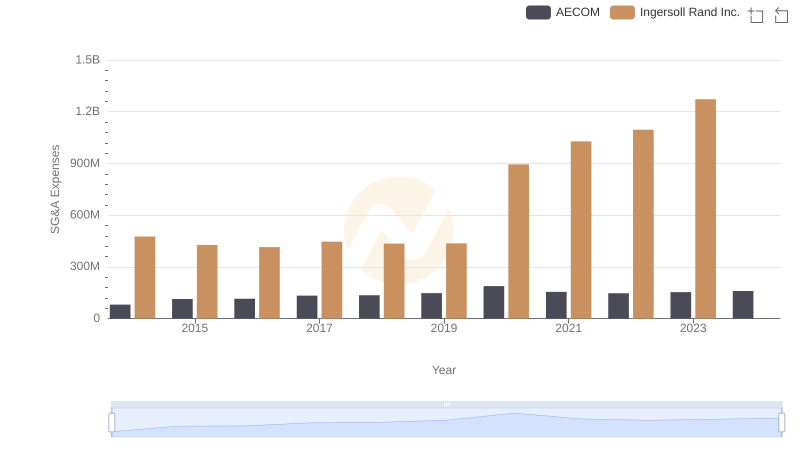
Ingersoll Rand Inc. or AECOM: Who Manages SG&A Costs Better?
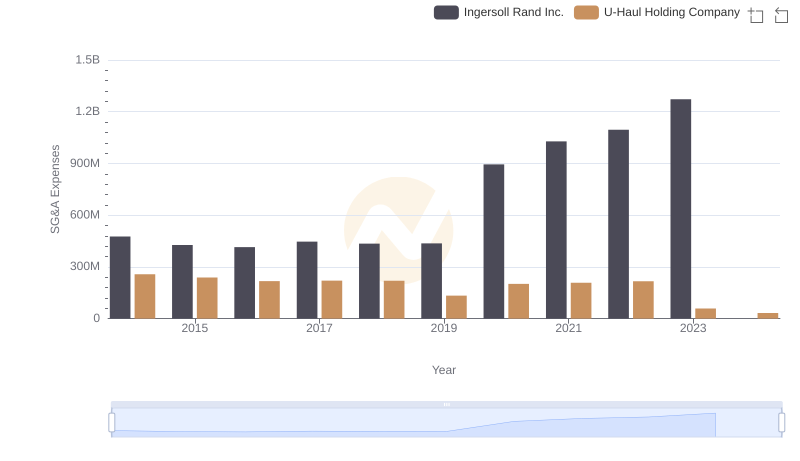
SG&A Efficiency Analysis: Comparing Ingersoll Rand Inc. and U-Haul Holding Company
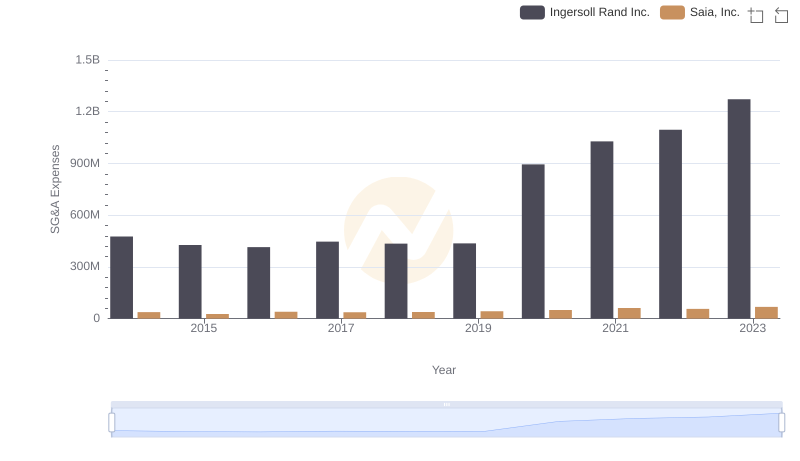
SG&A Efficiency Analysis: Comparing Ingersoll Rand Inc. and Saia, Inc.