| __timestamp | Cisco Systems, Inc. | Gartner, Inc. |
|---|---|---|
| Wednesday, January 1, 2014 | 19373000000 | 797933000 |
| Thursday, January 1, 2015 | 19480000000 | 839076000 |
| Friday, January 1, 2016 | 18287000000 | 945648000 |
| Sunday, January 1, 2017 | 17781000000 | 1320198000 |
| Monday, January 1, 2018 | 18724000000 | 1468800000 |
| Tuesday, January 1, 2019 | 19238000000 | 1550568000 |
| Wednesday, January 1, 2020 | 17618000000 | 1345096000 |
| Friday, January 1, 2021 | 17924000000 | 1444106000 |
| Saturday, January 1, 2022 | 19309000000 | 1693805000 |
| Sunday, January 1, 2023 | 21245000000 | 1903240000 |
| Monday, January 1, 2024 | 18975000000 | 0 |
Unlocking the unknown
In the ever-evolving tech industry, understanding cost structures is crucial. Cisco Systems, Inc. and Gartner, Inc. offer a fascinating study in contrasts. From 2014 to 2023, Cisco's cost of revenue fluctuated, peaking in 2023 with a 10% increase from 2022. Meanwhile, Gartner's costs rose steadily, culminating in a 19% increase over the same period. This divergence highlights Cisco's strategic shifts and Gartner's consistent growth.
The data for 2024 is incomplete, suggesting potential shifts in the coming year. Stay tuned for more insights as these industry giants continue to evolve.
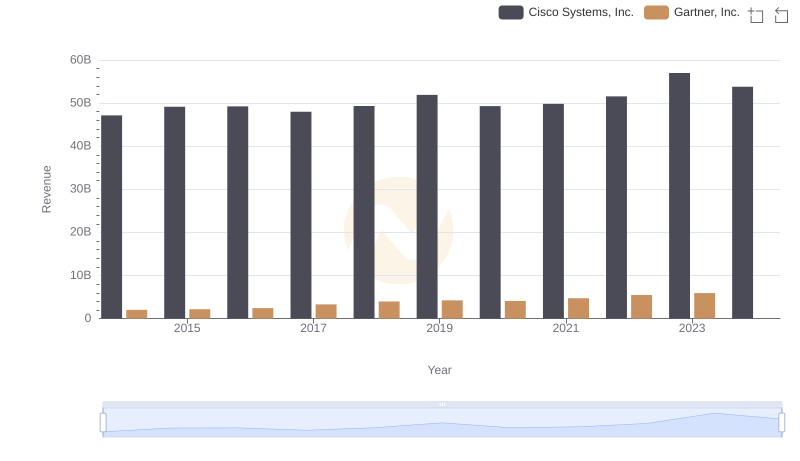
Comparing Revenue Performance: Cisco Systems, Inc. or Gartner, Inc.?
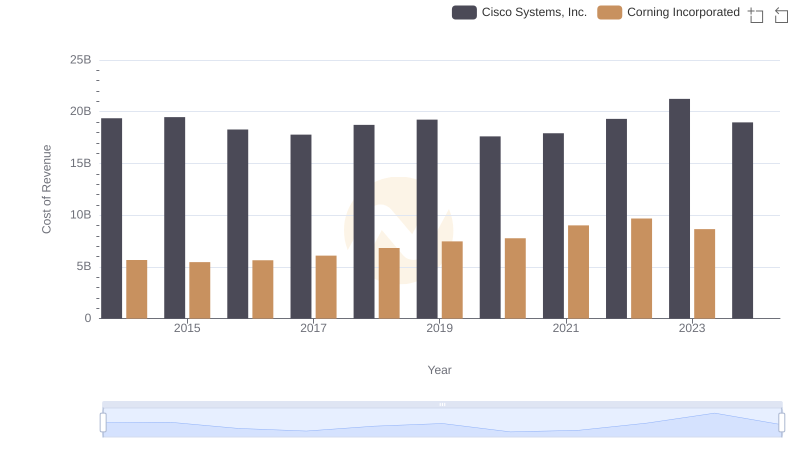
Cost of Revenue Trends: Cisco Systems, Inc. vs Corning Incorporated
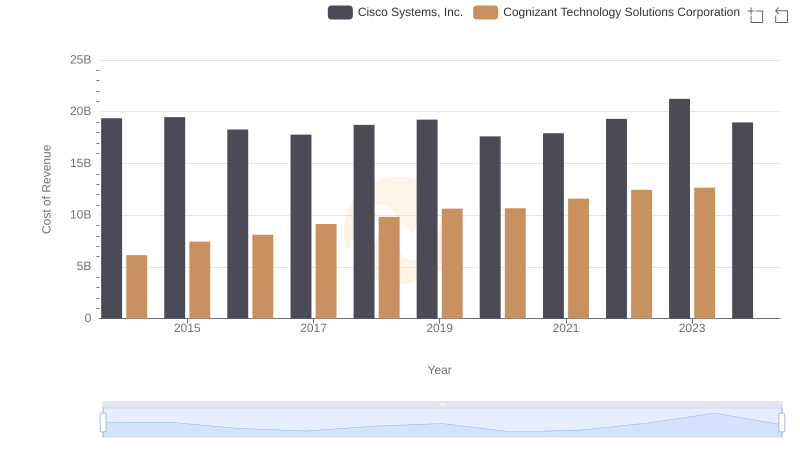
Analyzing Cost of Revenue: Cisco Systems, Inc. and Cognizant Technology Solutions Corporation
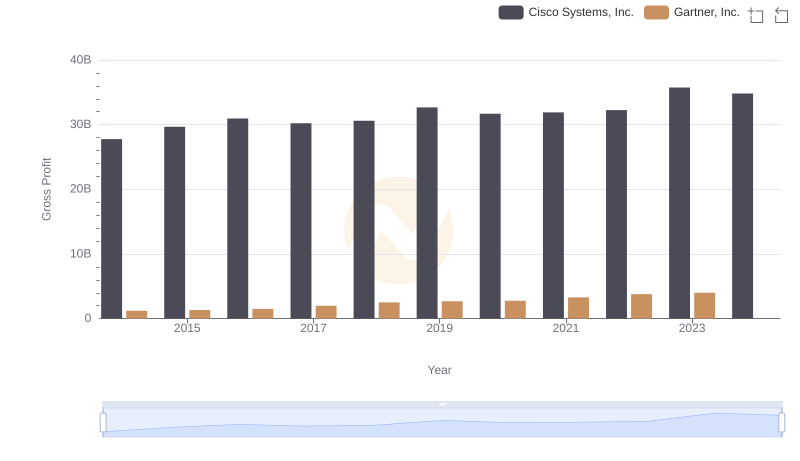
Cisco Systems, Inc. and Gartner, Inc.: A Detailed Gross Profit Analysis
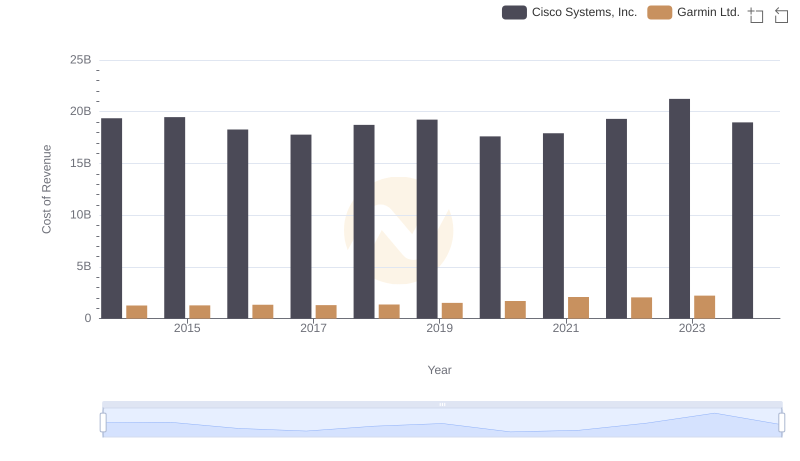
Cost of Revenue Trends: Cisco Systems, Inc. vs Garmin Ltd.
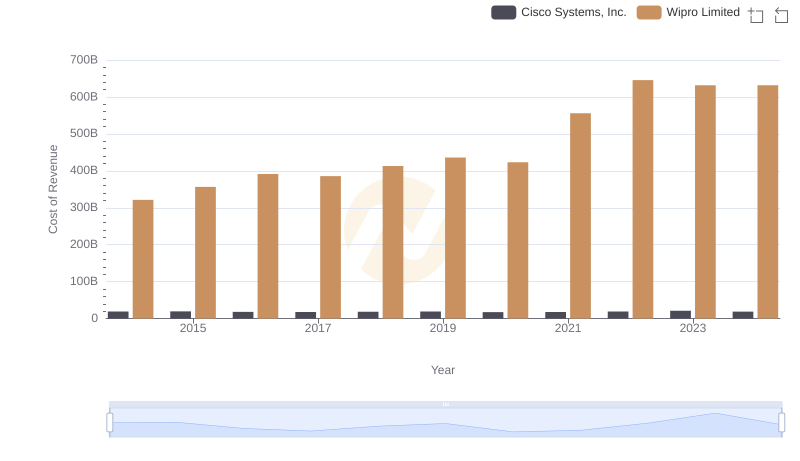
Cost of Revenue Trends: Cisco Systems, Inc. vs Wipro Limited
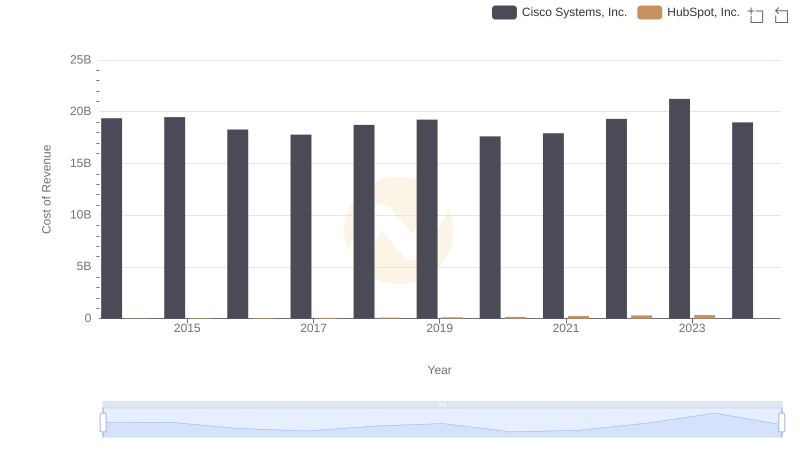
Cisco Systems, Inc. vs HubSpot, Inc.: Efficiency in Cost of Revenue Explored
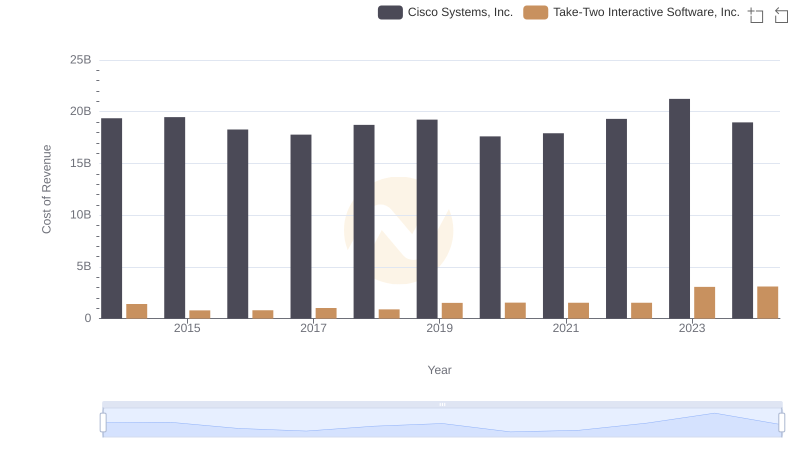
Cisco Systems, Inc. vs Take-Two Interactive Software, Inc.: Efficiency in Cost of Revenue Explored
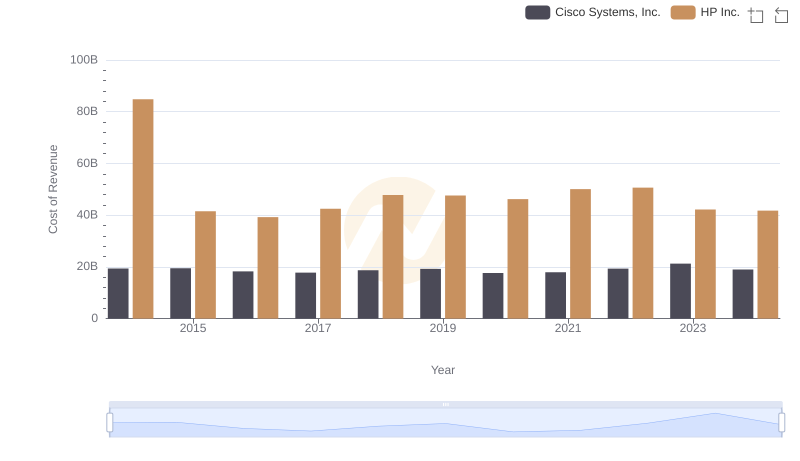
Cost of Revenue: Key Insights for Cisco Systems, Inc. and HP Inc.
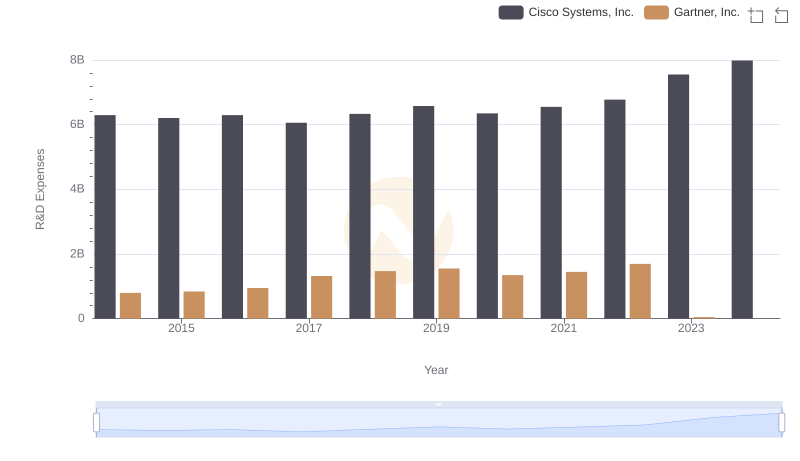
Cisco Systems, Inc. vs Gartner, Inc.: Strategic Focus on R&D Spending

Operational Costs Compared: SG&A Analysis of Cisco Systems, Inc. and Gartner, Inc.
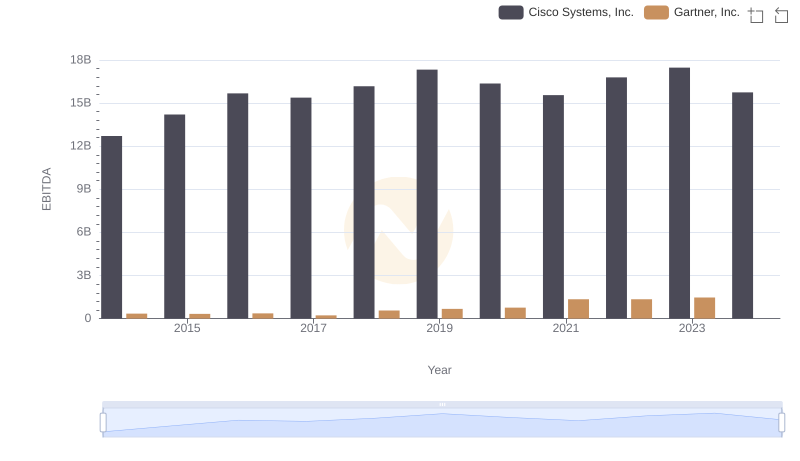
EBITDA Performance Review: Cisco Systems, Inc. vs Gartner, Inc.