| __timestamp | Cisco Systems, Inc. | Gartner, Inc. |
|---|---|---|
| Wednesday, January 1, 2014 | 27769000000 | 1223508000 |
| Thursday, January 1, 2015 | 29681000000 | 1323980000 |
| Friday, January 1, 2016 | 30960000000 | 1498892000 |
| Sunday, January 1, 2017 | 30224000000 | 1991296000 |
| Monday, January 1, 2018 | 30606000000 | 2506654000 |
| Tuesday, January 1, 2019 | 32666000000 | 2694753000 |
| Wednesday, January 1, 2020 | 31683000000 | 2754348000 |
| Friday, January 1, 2021 | 31894000000 | 3289833000 |
| Saturday, January 1, 2022 | 32248000000 | 3782024000 |
| Sunday, January 1, 2023 | 35753000000 | 4003716000 |
| Monday, January 1, 2024 | 34828000000 | 6267411000 |
Data in motion
In the ever-evolving tech industry, Cisco Systems, Inc. and Gartner, Inc. have demonstrated remarkable financial resilience over the past decade. From 2014 to 2023, Cisco's gross profit surged by approximately 29%, peaking in 2023. This growth underscores Cisco's robust market position and strategic innovations. Meanwhile, Gartner's gross profit witnessed an impressive 227% increase, reflecting its expanding influence in the research and advisory sector. Notably, Gartner's growth trajectory accelerated post-2017, highlighting its successful adaptation to market demands. However, data for 2024 remains incomplete, leaving room for speculation on future trends. This analysis offers a compelling glimpse into the financial dynamics of two industry giants, showcasing their ability to navigate challenges and capitalize on opportunities.
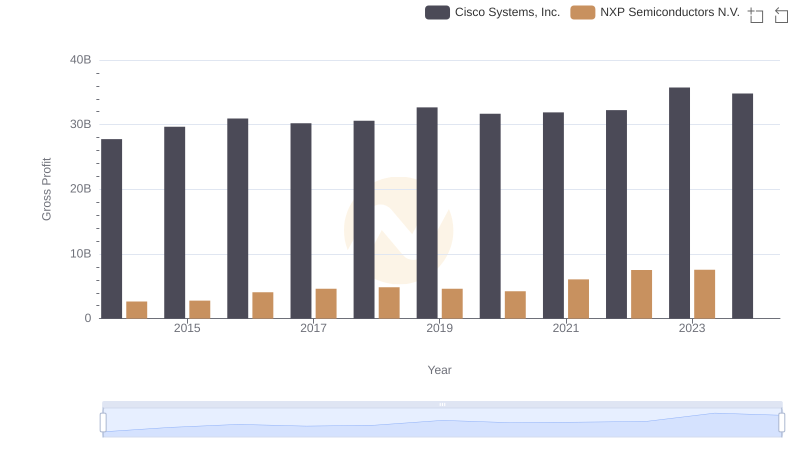
Key Insights on Gross Profit: Cisco Systems, Inc. vs NXP Semiconductors N.V.
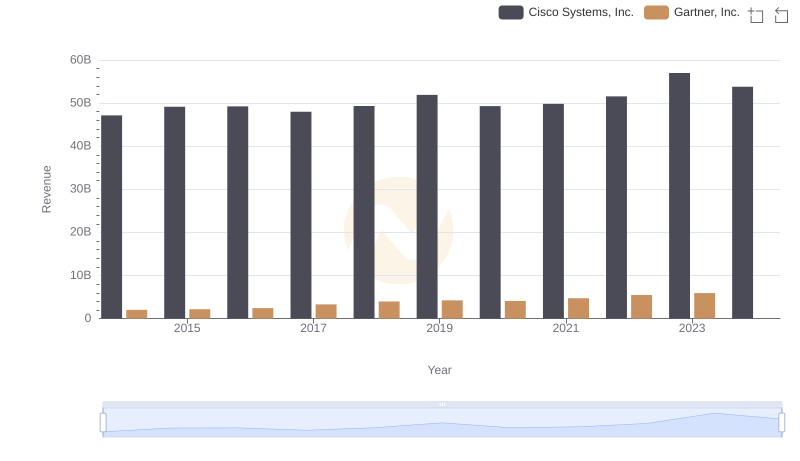
Comparing Revenue Performance: Cisco Systems, Inc. or Gartner, Inc.?
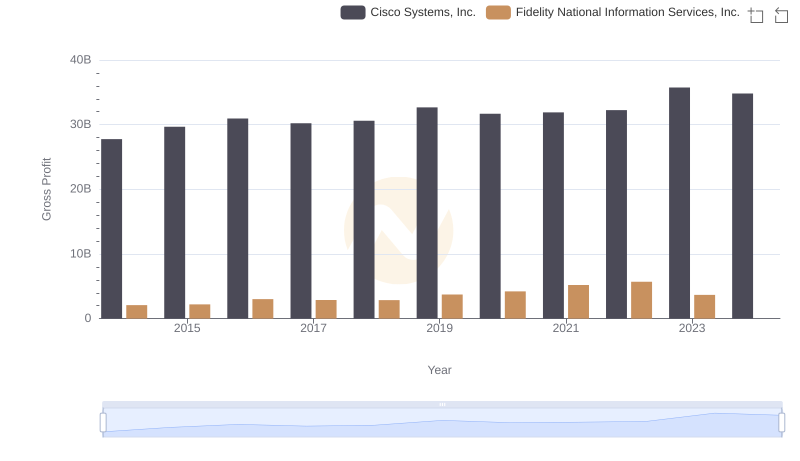
Cisco Systems, Inc. and Fidelity National Information Services, Inc.: A Detailed Gross Profit Analysis
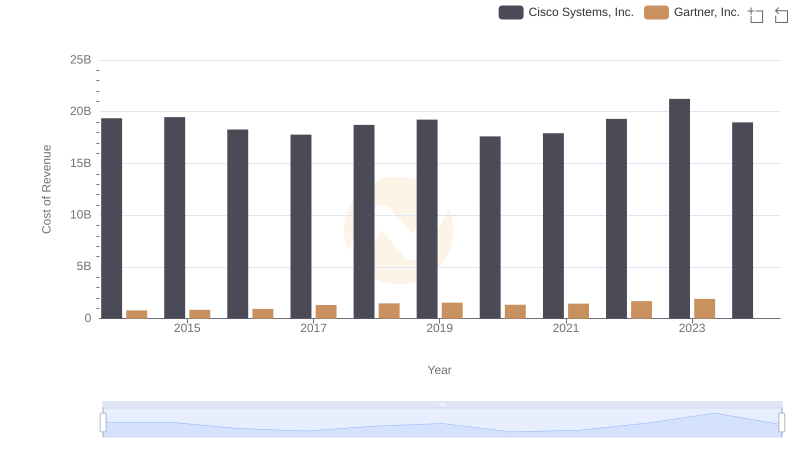
Cost of Revenue: Key Insights for Cisco Systems, Inc. and Gartner, Inc.
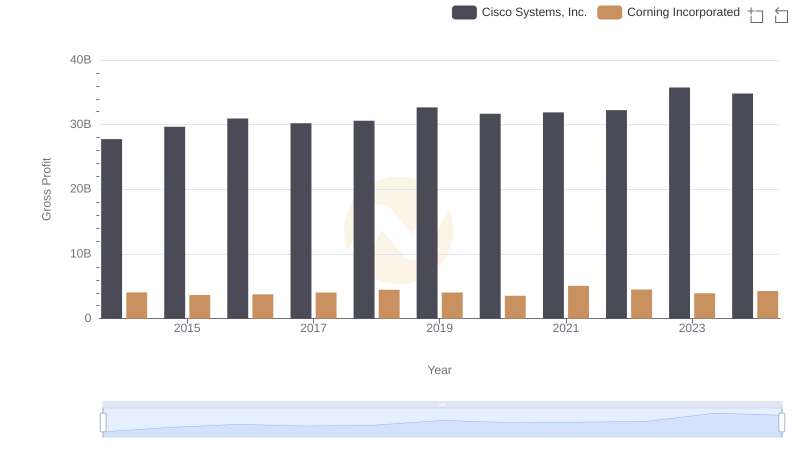
Who Generates Higher Gross Profit? Cisco Systems, Inc. or Corning Incorporated

Cisco Systems, Inc. and Cognizant Technology Solutions Corporation: A Detailed Gross Profit Analysis
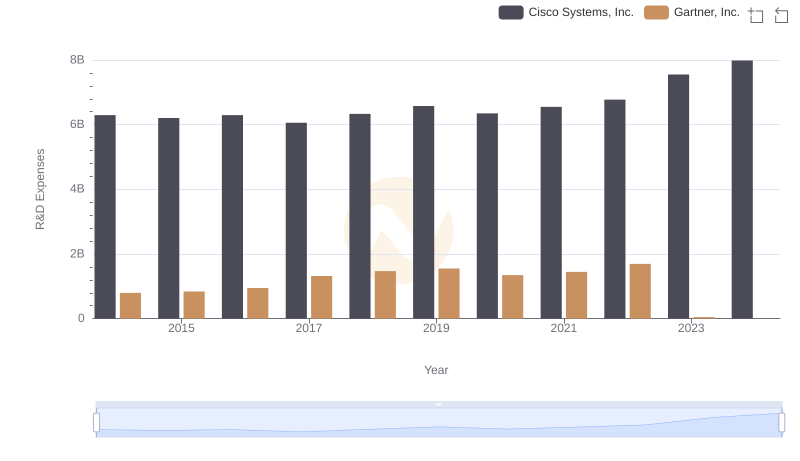
Cisco Systems, Inc. vs Gartner, Inc.: Strategic Focus on R&D Spending

Gross Profit Trends Compared: Cisco Systems, Inc. vs Garmin Ltd.
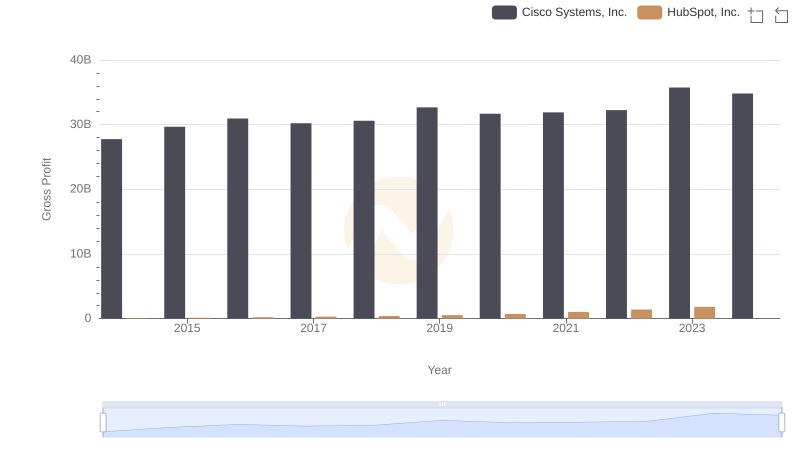
Who Generates Higher Gross Profit? Cisco Systems, Inc. or HubSpot, Inc.
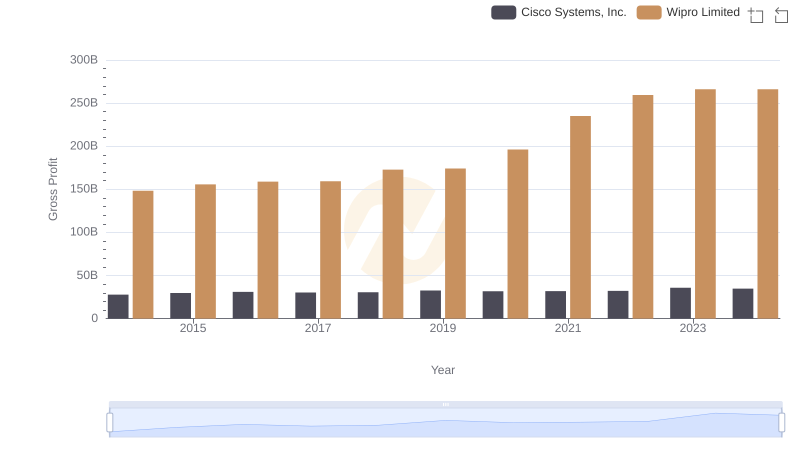
Gross Profit Analysis: Comparing Cisco Systems, Inc. and Wipro Limited

Operational Costs Compared: SG&A Analysis of Cisco Systems, Inc. and Gartner, Inc.
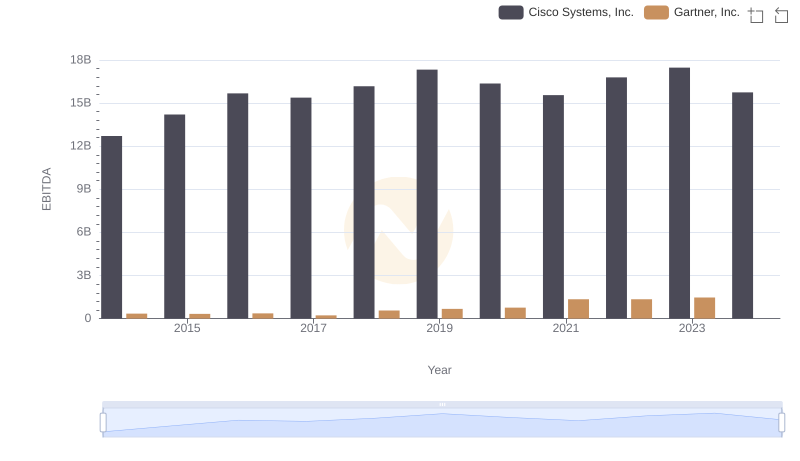
EBITDA Performance Review: Cisco Systems, Inc. vs Gartner, Inc.