| __timestamp | Equifax Inc. | Jacobs Engineering Group Inc. |
|---|---|---|
| Wednesday, January 1, 2014 | 1591700000 | 2073784000 |
| Thursday, January 1, 2015 | 1776200000 | 1968338000 |
| Friday, January 1, 2016 | 2031500000 | 1767831000 |
| Sunday, January 1, 2017 | 2151500000 | 1772252000 |
| Monday, January 1, 2018 | 1971700000 | 2828370000 |
| Tuesday, January 1, 2019 | 1985900000 | 2477028000 |
| Wednesday, January 1, 2020 | 2390100000 | 2586668000 |
| Friday, January 1, 2021 | 2943000000 | 3043772000 |
| Saturday, January 1, 2022 | 2945000000 | 3327040000 |
| Sunday, January 1, 2023 | 2930100000 | 3473315000 |
| Monday, January 1, 2024 | 5681100000 | 2832756000 |
Cracking the code
In the ever-evolving landscape of corporate finance, understanding gross profit trends is crucial for investors and analysts alike. Over the past decade, Equifax Inc. and Jacobs Engineering Group Inc. have showcased intriguing trajectories in their financial performance. From 2014 to 2023, Equifax's gross profit surged by approximately 84%, peaking in 2022 with a remarkable $2.95 billion. Meanwhile, Jacobs Engineering Group Inc. demonstrated a robust growth of around 67%, reaching its zenith in 2023 with $3.47 billion.
Interestingly, while Equifax experienced a slight dip in 2023, Jacobs Engineering continued its upward momentum. This divergence highlights the dynamic nature of these industries, with Jacobs Engineering capitalizing on infrastructure demands. As we look to the future, the missing data for 2024 suggests potential shifts, urging stakeholders to stay vigilant and informed.
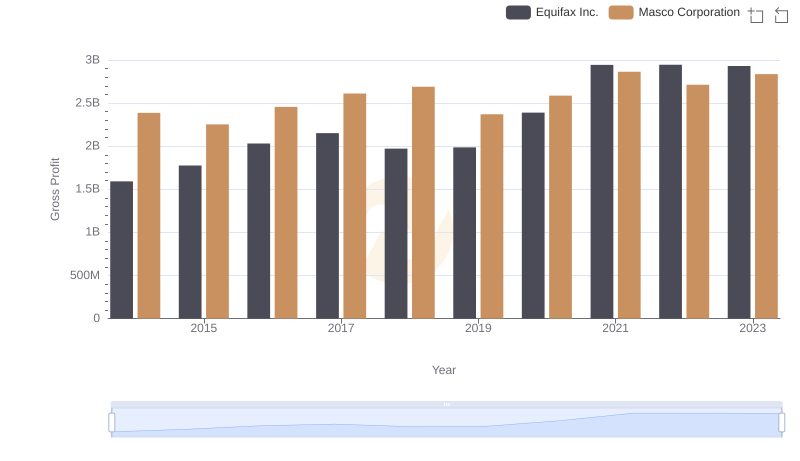
Key Insights on Gross Profit: Equifax Inc. vs Masco Corporation
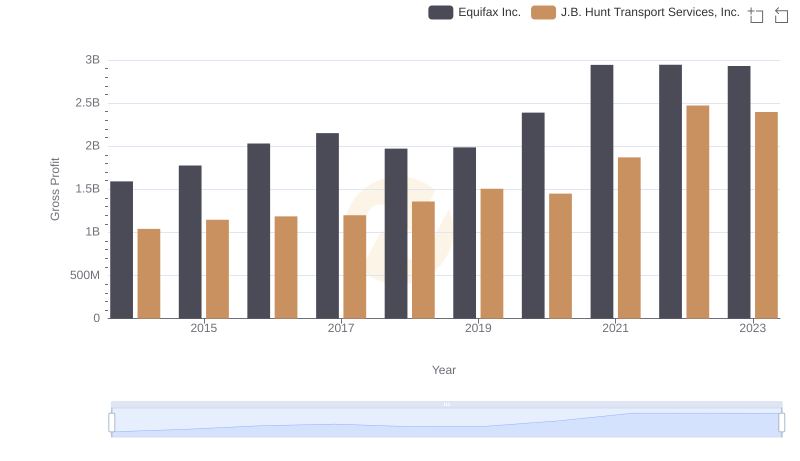
Gross Profit Analysis: Comparing Equifax Inc. and J.B. Hunt Transport Services, Inc.
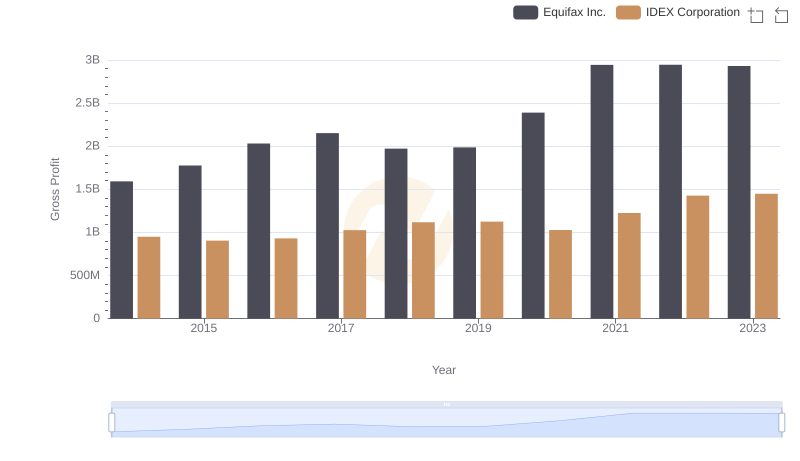
Gross Profit Trends Compared: Equifax Inc. vs IDEX Corporation
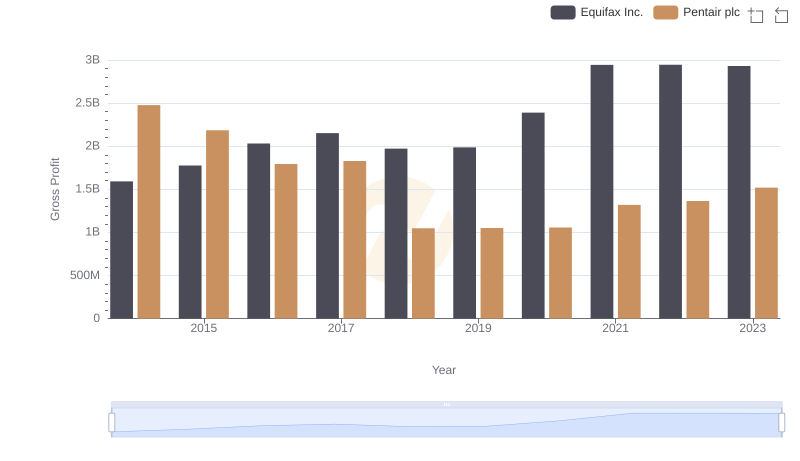
Key Insights on Gross Profit: Equifax Inc. vs Pentair plc
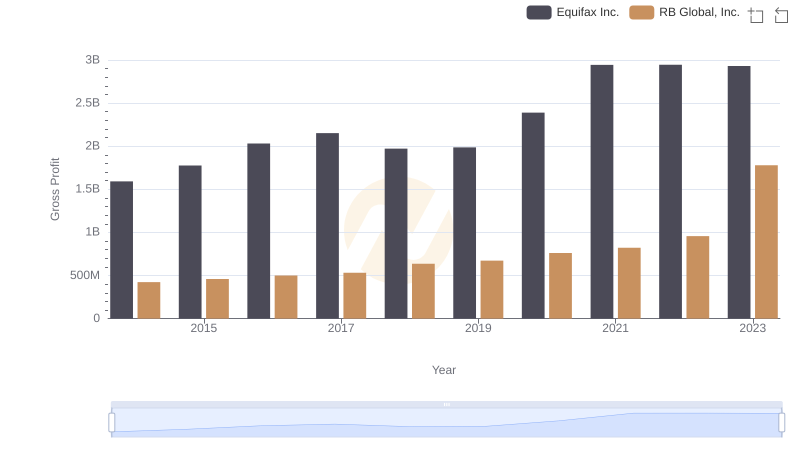
Gross Profit Comparison: Equifax Inc. and RB Global, Inc. Trends
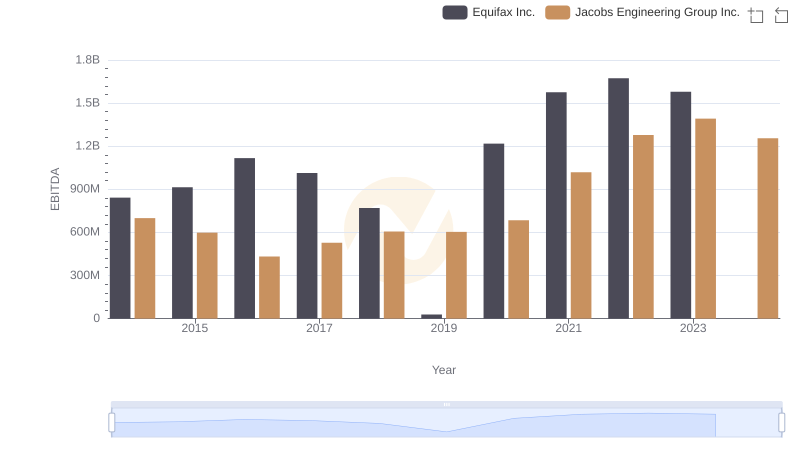
Equifax Inc. vs Jacobs Engineering Group Inc.: In-Depth EBITDA Performance Comparison