| __timestamp | Equifax Inc. | Jacobs Engineering Group Inc. |
|---|---|---|
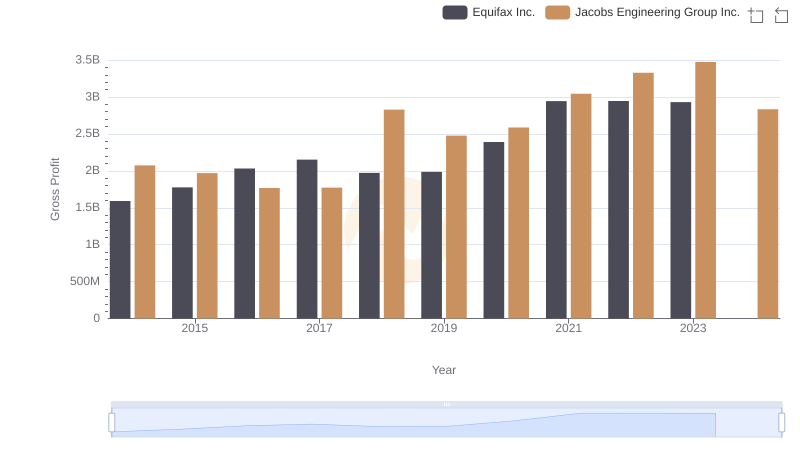
| Wednesday, January 1, 2014 | 842400000 | 699015000 |
| Thursday, January 1, 2015 | 914600000 | 598932000 |
| Friday, January 1, 2016 | 1116900000 | 431954000 |
| Sunday, January 1, 2017 | 1013900000 | 527765000 |
| Monday, January 1, 2018 | 770200000 | 606328000 |
| Tuesday, January 1, 2019 | 29000000 | 604075000 |
| Wednesday, January 1, 2020 | 1217800000 | 685042000 |
| Friday, January 1, 2021 | 1575200000 | 1019116000 |
| Saturday, January 1, 2022 | 1672800000 | 1277649000 |
| Sunday, January 1, 2023 | 1579100000 | 1392039000 |
| Monday, January 1, 2024 | 1251200000 | 1255083000 |
Igniting the spark of knowledge
In the ever-evolving landscape of corporate finance, understanding EBITDA trends offers invaluable insights into a company's operational efficiency. From 2014 to 2023, Equifax Inc. and Jacobs Engineering Group Inc. have showcased distinct trajectories in their EBITDA performance. Equifax Inc. experienced a remarkable growth of approximately 87% from 2014 to 2022, peaking in 2022 with a 1.67 billion EBITDA. However, 2019 marked a significant downturn, with EBITDA plummeting to a mere 29 million, highlighting potential operational challenges.
Conversely, Jacobs Engineering Group Inc. demonstrated a steady upward trend, with a 99% increase in EBITDA from 2014 to 2023, reaching 1.39 billion in 2023. This consistent growth underscores Jacobs' robust financial strategies and adaptability in a competitive market. Notably, the data for Equifax in 2024 is missing, leaving room for speculation on its future performance.
This comparative analysis not only highlights the financial health of these industry giants but also provides a lens through which investors can gauge potential investment opportunities.