| __timestamp | CSX Corporation | Clean Harbors, Inc. |
|---|---|---|
| Wednesday, January 1, 2014 | 3613000000 | 959840000 |
| Thursday, January 1, 2015 | 3584000000 | 918331000 |
| Friday, January 1, 2016 | 3389000000 | 822369000 |
| Sunday, January 1, 2017 | 3773000000 | 882305000 |
| Monday, January 1, 2018 | 4773000000 | 994752000 |
| Tuesday, January 1, 2019 | 4874000000 | 1024371000 |
| Wednesday, January 1, 2020 | 4362000000 | 1006346000 |
| Friday, January 1, 2021 | 5140000000 | 1195729000 |
| Saturday, January 1, 2022 | 5785000000 | 1622675000 |
| Sunday, January 1, 2023 | 5527000000 | 1663028000 |
| Monday, January 1, 2024 | 1824239000 |
Unveiling the hidden dimensions of data
In the ever-evolving landscape of American industry, the financial performance of companies like CSX Corporation and Clean Harbors, Inc. offers a fascinating glimpse into their operational prowess. Over the past decade, CSX Corporation has consistently outperformed Clean Harbors, Inc. in terms of gross profit. From 2014 to 2023, CSX's gross profit surged by approximately 53%, peaking in 2022 with a remarkable 5.8 billion dollars. In contrast, Clean Harbors, Inc. experienced a more modest growth of around 73% during the same period, reaching its highest gross profit of 1.66 billion dollars in 2023.
This analysis highlights the robust growth trajectory of both companies, with CSX Corporation maintaining a dominant position. The data underscores the resilience and adaptability of these industry giants, reflecting broader economic trends and strategic business decisions that have shaped their financial success.
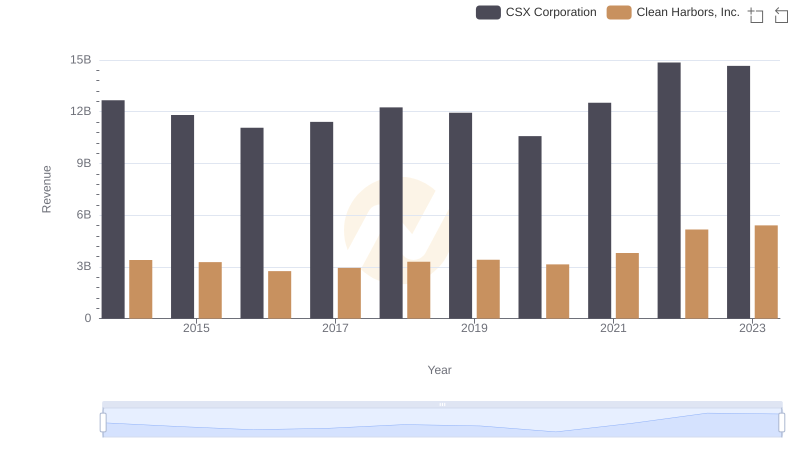
Revenue Insights: CSX Corporation and Clean Harbors, Inc. Performance Compared
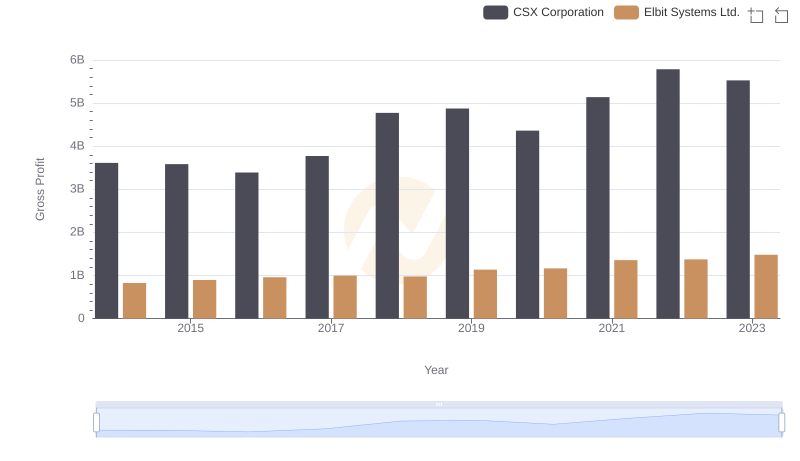
Gross Profit Trends Compared: CSX Corporation vs Elbit Systems Ltd.
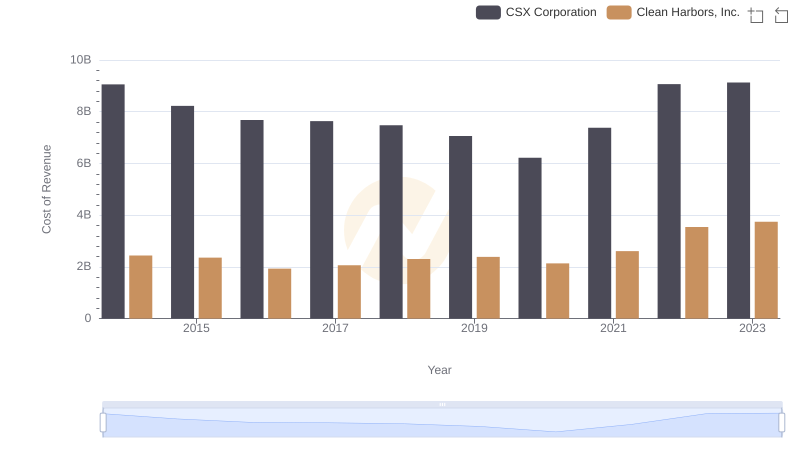
Cost of Revenue Comparison: CSX Corporation vs Clean Harbors, Inc.
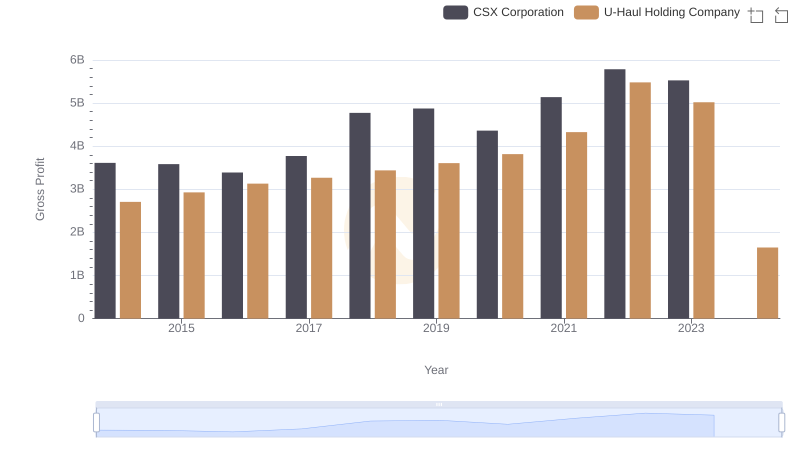
CSX Corporation vs U-Haul Holding Company: A Gross Profit Performance Breakdown
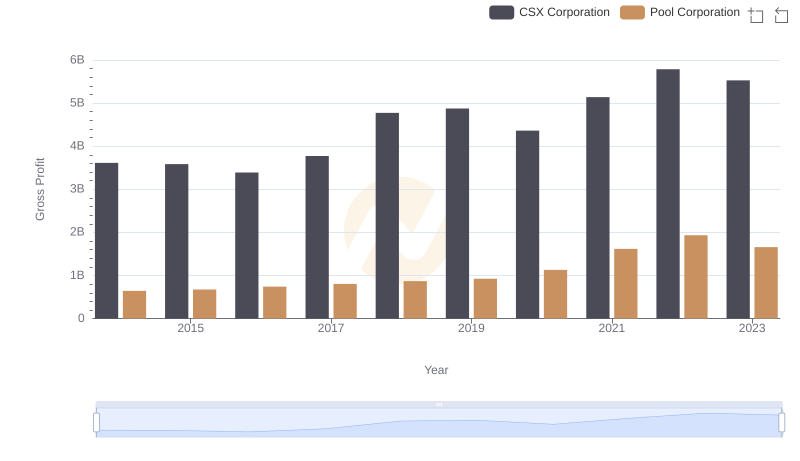
CSX Corporation vs Pool Corporation: A Gross Profit Performance Breakdown
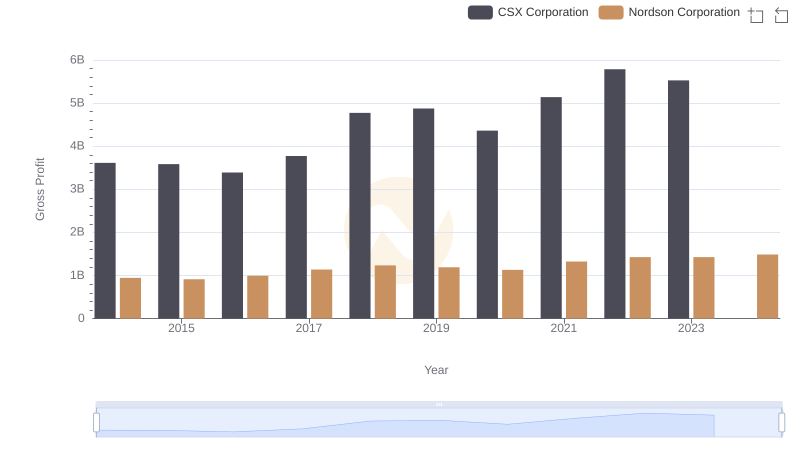
Gross Profit Trends Compared: CSX Corporation vs Nordson Corporation
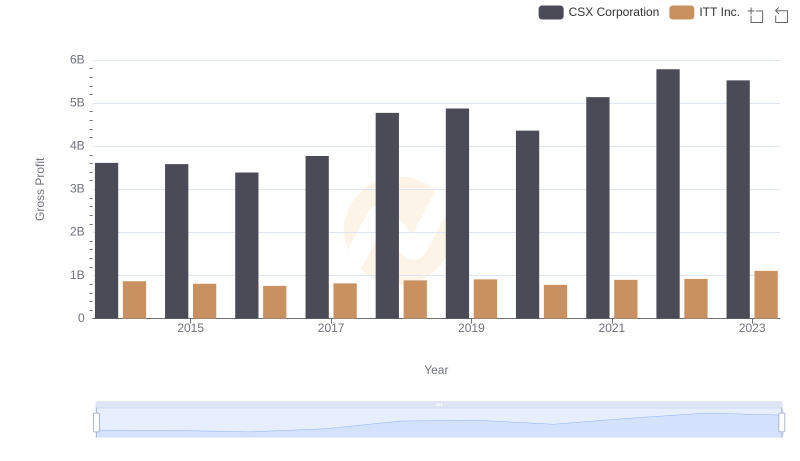
Gross Profit Comparison: CSX Corporation and ITT Inc. Trends