| __timestamp | CSX Corporation | ITT Inc. |
|---|---|---|
| Wednesday, January 1, 2014 | 3613000000 | 866400000 |
| Thursday, January 1, 2015 | 3584000000 | 809100000 |
| Friday, January 1, 2016 | 3389000000 | 758200000 |
| Sunday, January 1, 2017 | 3773000000 | 817200000 |
| Monday, January 1, 2018 | 4773000000 | 887200000 |
| Tuesday, January 1, 2019 | 4874000000 | 910100000 |
| Wednesday, January 1, 2020 | 4362000000 | 782200000 |
| Friday, January 1, 2021 | 5140000000 | 899500000 |
| Saturday, January 1, 2022 | 5785000000 | 922300000 |
| Sunday, January 1, 2023 | 5527000000 | 1107300000 |
| Monday, January 1, 2024 | 1247300000 |
Unleashing the power of data
In the ever-evolving landscape of American industry, CSX Corporation and ITT Inc. have showcased intriguing financial trajectories over the past decade. From 2014 to 2023, CSX Corporation's gross profit surged by approximately 53%, peaking in 2022. This growth reflects the company's strategic adaptations in the transportation sector, capitalizing on increased demand and operational efficiencies.
Conversely, ITT Inc., a key player in the manufacturing sector, experienced a more modest growth of around 28% in the same period. Despite facing challenges, ITT Inc. demonstrated resilience, achieving its highest gross profit in 2023. This upward trend underscores ITT's commitment to innovation and market expansion.
These contrasting growth patterns highlight the dynamic nature of the U.S. economy, where diverse industries navigate unique challenges and opportunities. As we look to the future, both companies remain pivotal in their respective sectors, shaping the economic landscape.
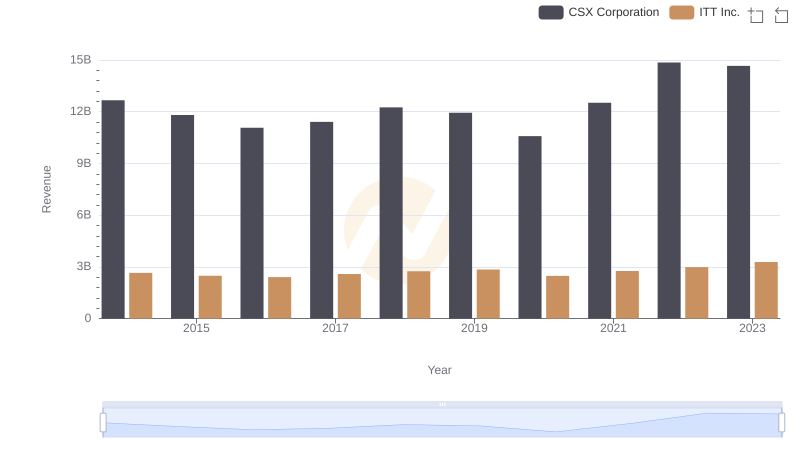
CSX Corporation vs ITT Inc.: Annual Revenue Growth Compared
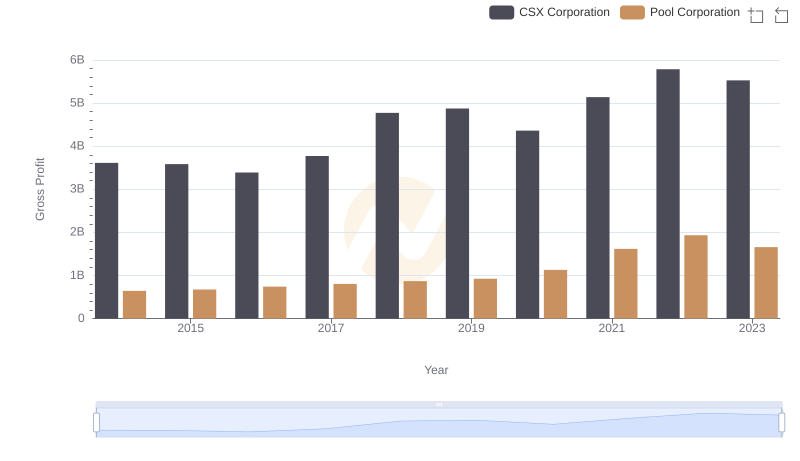
CSX Corporation vs Pool Corporation: A Gross Profit Performance Breakdown
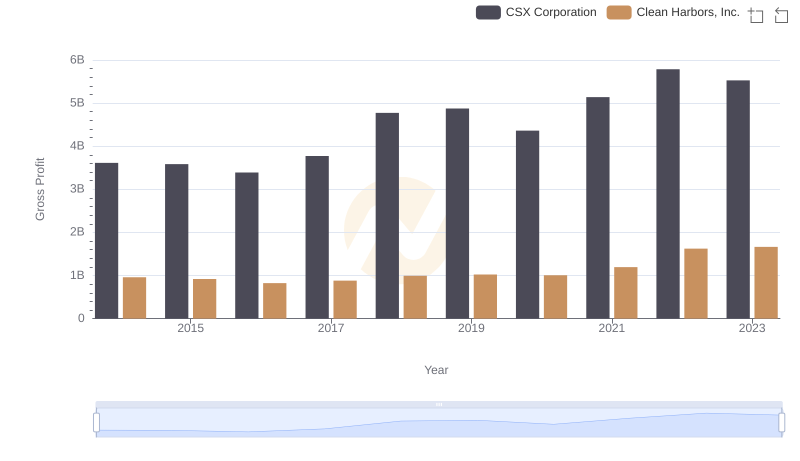
Gross Profit Analysis: Comparing CSX Corporation and Clean Harbors, Inc.
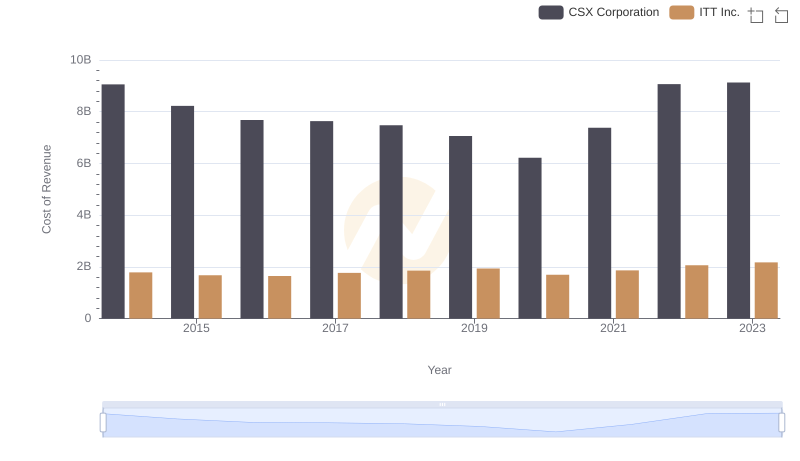
Cost of Revenue: Key Insights for CSX Corporation and ITT Inc.
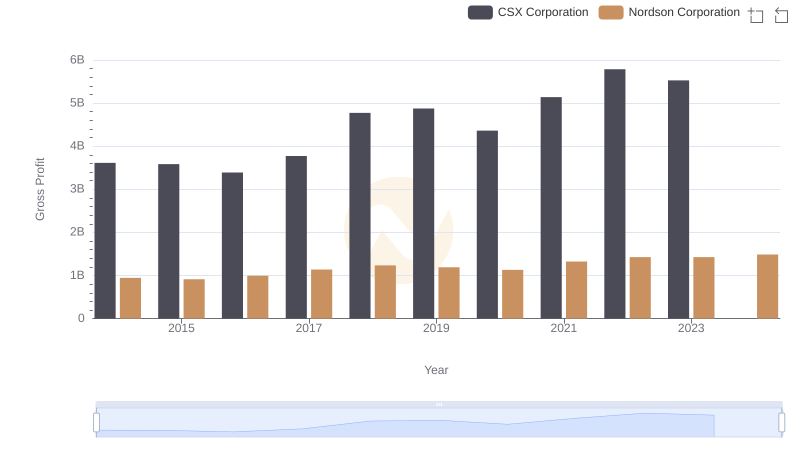
Gross Profit Trends Compared: CSX Corporation vs Nordson Corporation
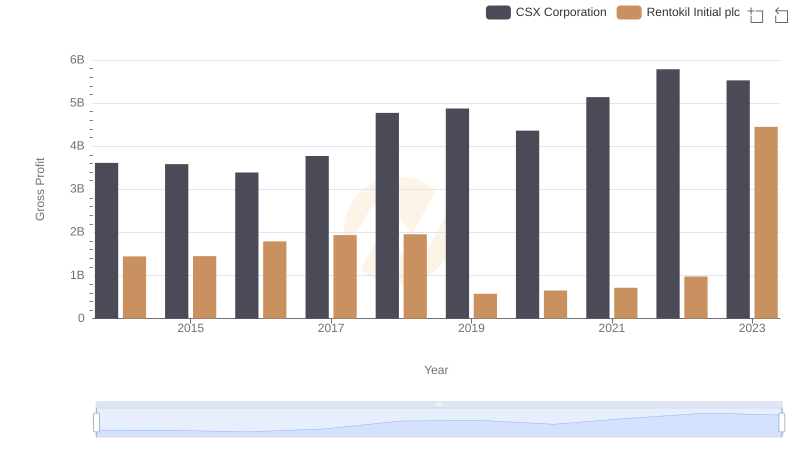
Gross Profit Comparison: CSX Corporation and Rentokil Initial plc Trends
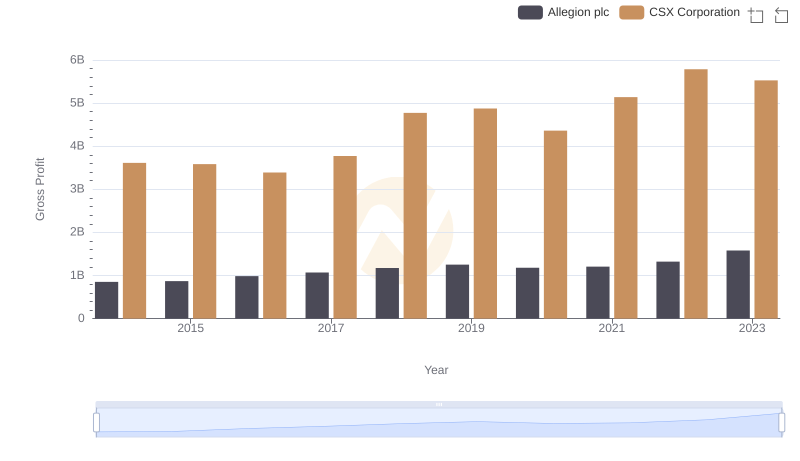
Gross Profit Trends Compared: CSX Corporation vs Allegion plc
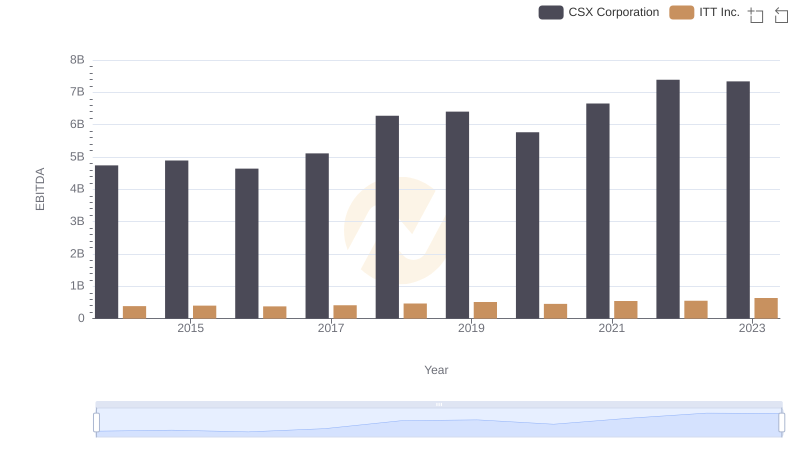
CSX Corporation and ITT Inc.: A Detailed Examination of EBITDA Performance
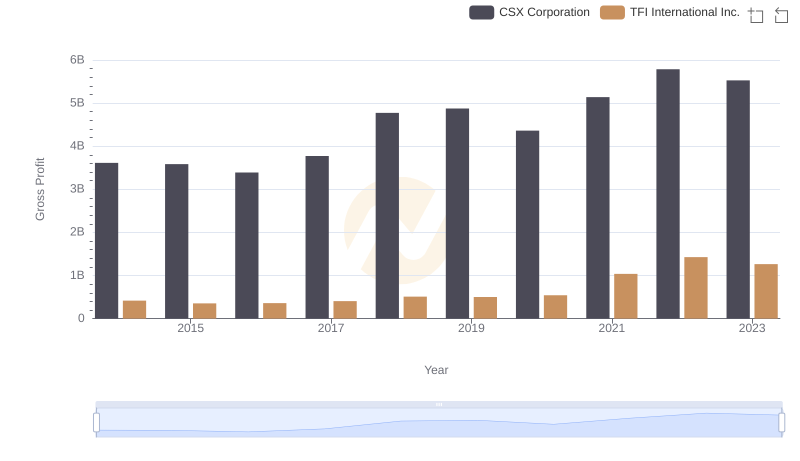
Key Insights on Gross Profit: CSX Corporation vs TFI International Inc.