| __timestamp | Ingersoll Rand Inc. | Snap-on Incorporated |
|---|---|---|
| Wednesday, January 1, 2014 | 476000000 | 1047900000 |
| Thursday, January 1, 2015 | 427000000 | 1009100000 |
| Friday, January 1, 2016 | 414339000 | 1001400000 |
| Sunday, January 1, 2017 | 446600000 | 1101300000 |
| Monday, January 1, 2018 | 434600000 | 1080700000 |
| Tuesday, January 1, 2019 | 436400000 | 1071500000 |
| Wednesday, January 1, 2020 | 894800000 | 1054800000 |
| Friday, January 1, 2021 | 1028000000 | 1202300000 |
| Saturday, January 1, 2022 | 1095800000 | 1181200000 |
| Sunday, January 1, 2023 | 1272700000 | 1249000000 |
| Monday, January 1, 2024 | 0 | 0 |
Unleashing insights
In the ever-evolving landscape of corporate finance, managing Selling, General, and Administrative (SG&A) expenses is crucial for maintaining profitability. This analysis delves into the SG&A expenses of Ingersoll Rand Inc. and Snap-on Incorporated from 2014 to 2023. Over this period, Ingersoll Rand Inc. saw a staggering 167% increase in SG&A expenses, peaking at $1.27 billion in 2023. In contrast, Snap-on Incorporated maintained a more stable trajectory, with a modest 19% rise, reaching $1.25 billion in the same year.
Understanding these trends offers valuable insights into each company's financial strategies and market positioning, providing a window into their operational efficiencies and growth potential.
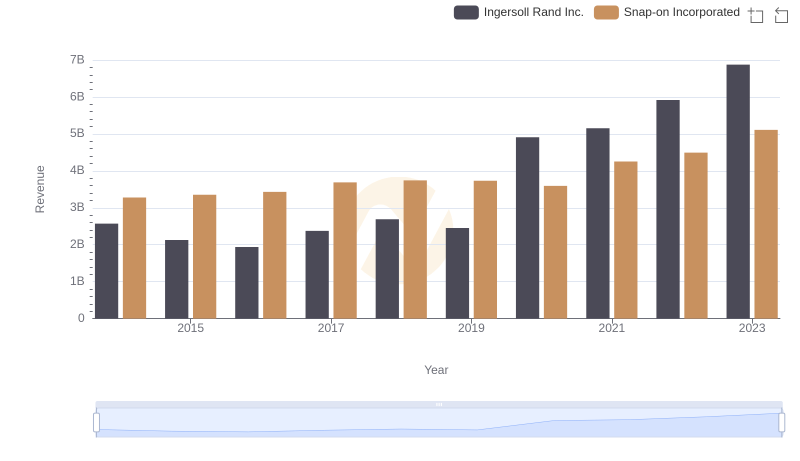
Ingersoll Rand Inc. vs Snap-on Incorporated: Examining Key Revenue Metrics
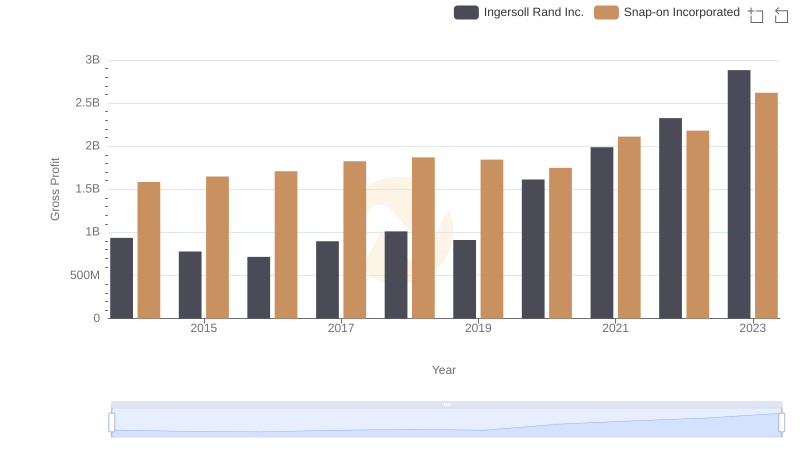
Key Insights on Gross Profit: Ingersoll Rand Inc. vs Snap-on Incorporated
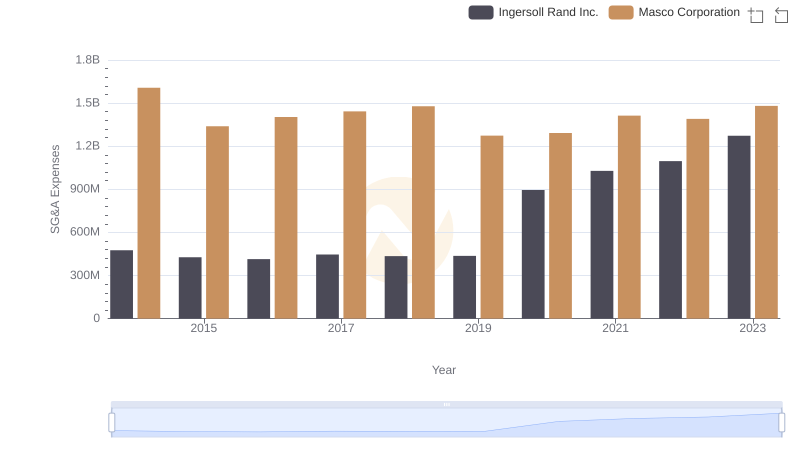
Ingersoll Rand Inc. or Masco Corporation: Who Manages SG&A Costs Better?
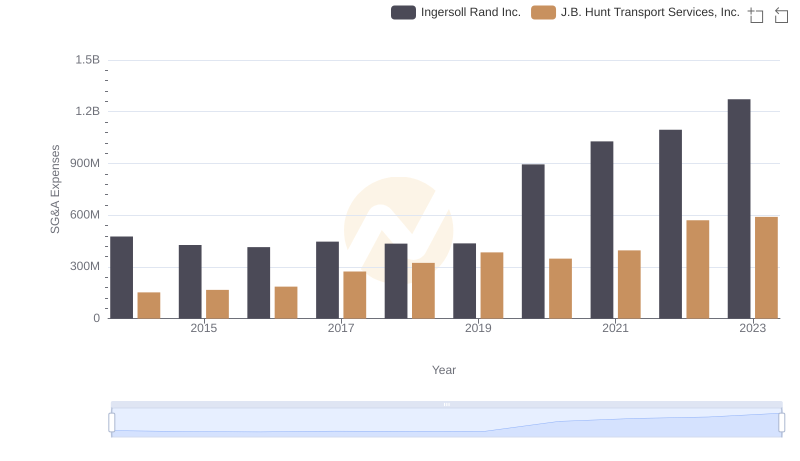
Ingersoll Rand Inc. or J.B. Hunt Transport Services, Inc.: Who Manages SG&A Costs Better?
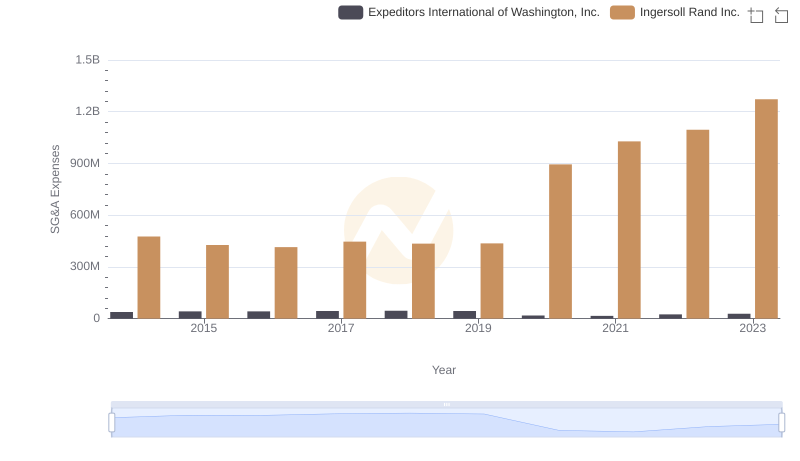
Ingersoll Rand Inc. and Expeditors International of Washington, Inc.: SG&A Spending Patterns Compared
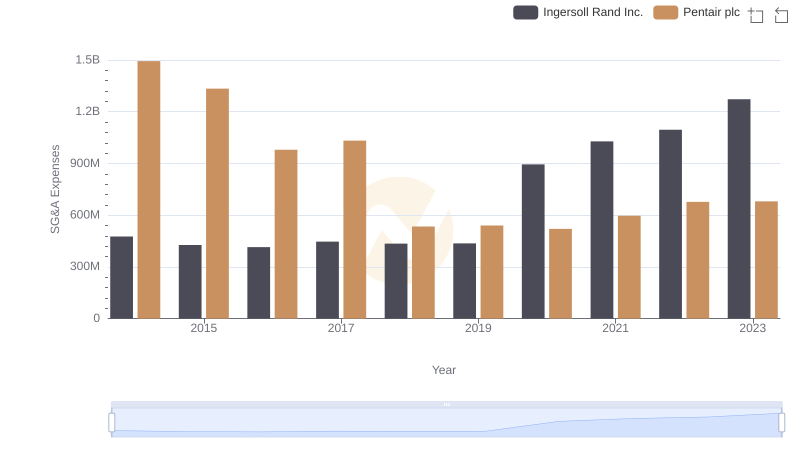
Comparing SG&A Expenses: Ingersoll Rand Inc. vs Pentair plc Trends and Insights