| __timestamp | Graco Inc. | Ingersoll Rand Inc. |
|---|---|---|
| Wednesday, January 1, 2014 | 666736000 | 936781000 |
| Thursday, January 1, 2015 | 684700000 | 779100000 |
| Friday, January 1, 2016 | 708239000 | 716731000 |
| Sunday, January 1, 2017 | 793049000 | 897900000 |
| Monday, January 1, 2018 | 882539000 | 1012500000 |
| Tuesday, January 1, 2019 | 859756000 | 911700000 |
| Wednesday, January 1, 2020 | 854937000 | 1613400000 |
| Friday, January 1, 2021 | 1033949000 | 1988500000 |
| Saturday, January 1, 2022 | 1057439000 | 2325600000 |
| Sunday, January 1, 2023 | 1161021000 | 2882200000 |
| Monday, January 1, 2024 | 1122461000 | 0 |
Unveiling the hidden dimensions of data
In the competitive landscape of industrial manufacturing, Ingersoll Rand Inc. and Graco Inc. have showcased intriguing gross profit trends over the past decade. From 2014 to 2023, Graco Inc. demonstrated a steady growth, with gross profits increasing by approximately 74%, peaking in 2023. Meanwhile, Ingersoll Rand Inc. experienced a more dramatic rise, with profits surging by over 200% during the same period, reaching their zenith in 2023.
The year 2020 marked a pivotal point for Ingersoll Rand, with profits nearly doubling compared to the previous year, likely due to strategic acquisitions and market expansion. Graco, while maintaining a consistent upward trajectory, saw its most significant growth between 2021 and 2023. As we look to 2024, data for Ingersoll Rand remains elusive, leaving industry analysts eager to see if this upward trend will continue.
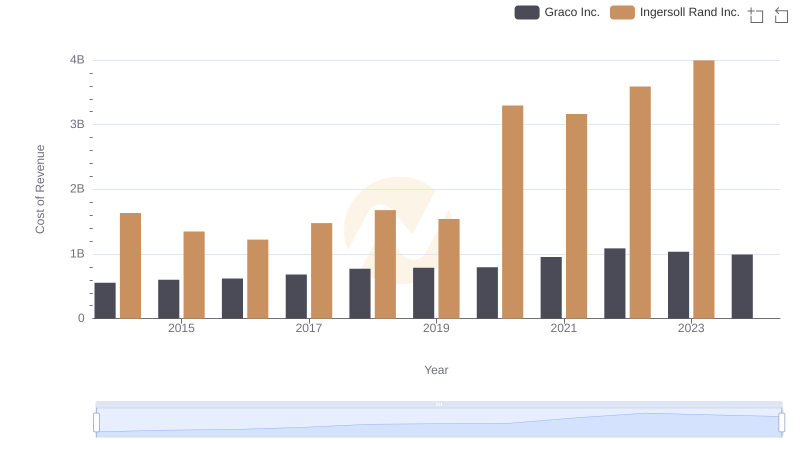
Cost of Revenue Comparison: Ingersoll Rand Inc. vs Graco Inc.
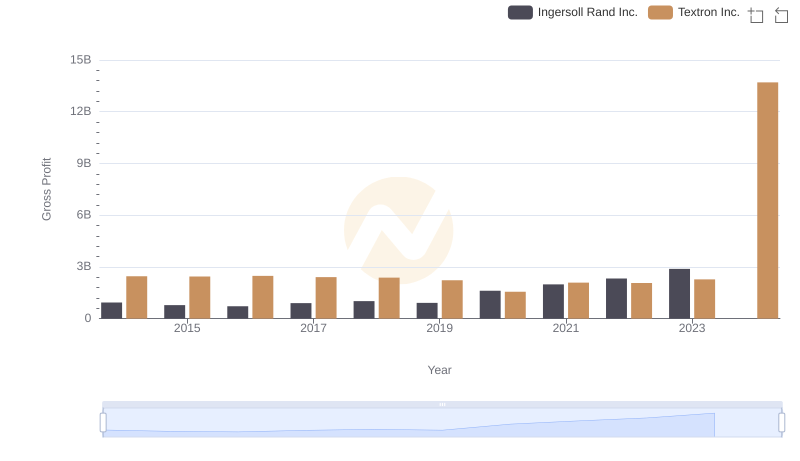
Gross Profit Analysis: Comparing Ingersoll Rand Inc. and Textron Inc.
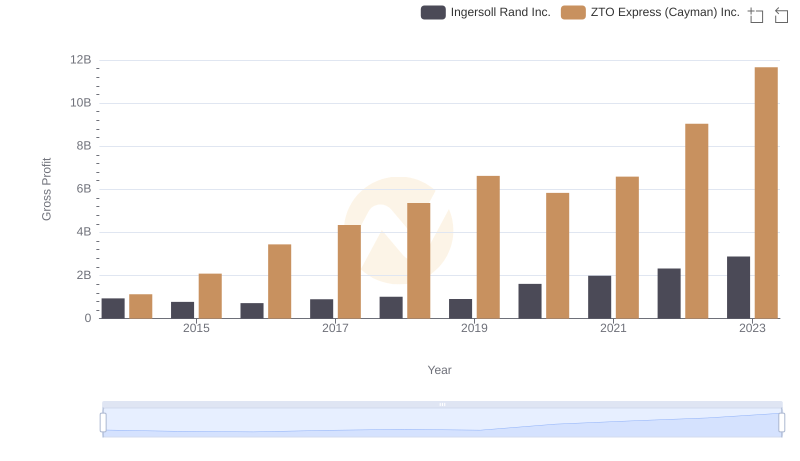
Gross Profit Comparison: Ingersoll Rand Inc. and ZTO Express (Cayman) Inc. Trends
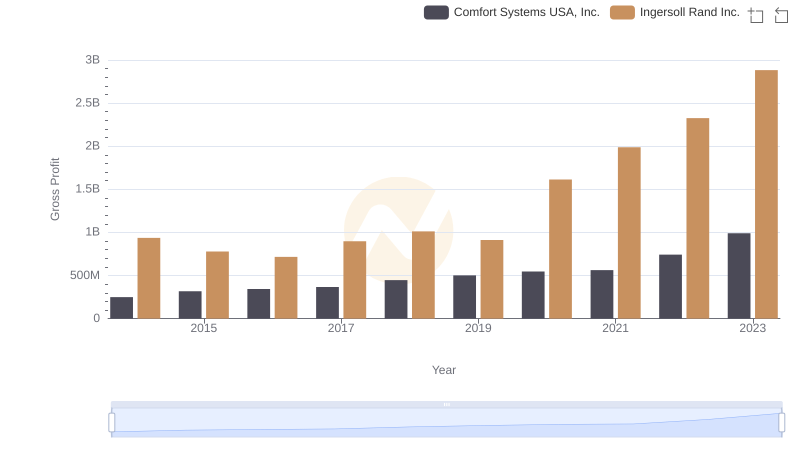
Key Insights on Gross Profit: Ingersoll Rand Inc. vs Comfort Systems USA, Inc.
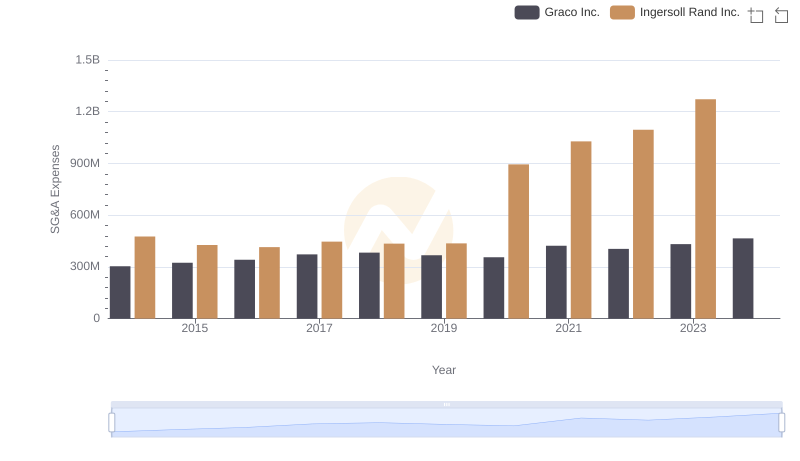
Ingersoll Rand Inc. vs Graco Inc.: SG&A Expense Trends