| __timestamp | Ingersoll Rand Inc. | Owens Corning |
|---|---|---|
| Wednesday, January 1, 2014 | 476000000 | 487000000 |
| Thursday, January 1, 2015 | 427000000 | 525000000 |
| Friday, January 1, 2016 | 414339000 | 584000000 |
| Sunday, January 1, 2017 | 446600000 | 620000000 |
| Monday, January 1, 2018 | 434600000 | 700000000 |
| Tuesday, January 1, 2019 | 436400000 | 698000000 |
| Wednesday, January 1, 2020 | 894800000 | 664000000 |
| Friday, January 1, 2021 | 1028000000 | 757000000 |
| Saturday, January 1, 2022 | 1095800000 | 803000000 |
| Sunday, January 1, 2023 | 1272700000 | 831000000 |
| Monday, January 1, 2024 | 0 |
Cracking the code
In the ever-evolving landscape of corporate finance, understanding the spending patterns of industry giants can offer valuable insights. Ingersoll Rand Inc. and Owens Corning, two stalwarts in their respective fields, have shown distinct trends in their Selling, General, and Administrative (SG&A) expenses over the past decade.
From 2014 to 2023, Ingersoll Rand's SG&A expenses surged by approximately 167%, reflecting strategic investments and expansion efforts. In contrast, Owens Corning's expenses grew by about 71%, indicating a more conservative approach. Notably, 2020 marked a pivotal year for Ingersoll Rand, with a significant 105% increase in SG&A expenses, possibly due to restructuring or acquisitions.
These patterns highlight the differing strategies of these companies in navigating market challenges and opportunities. As businesses continue to adapt, monitoring such financial metrics remains crucial for stakeholders and investors alike.
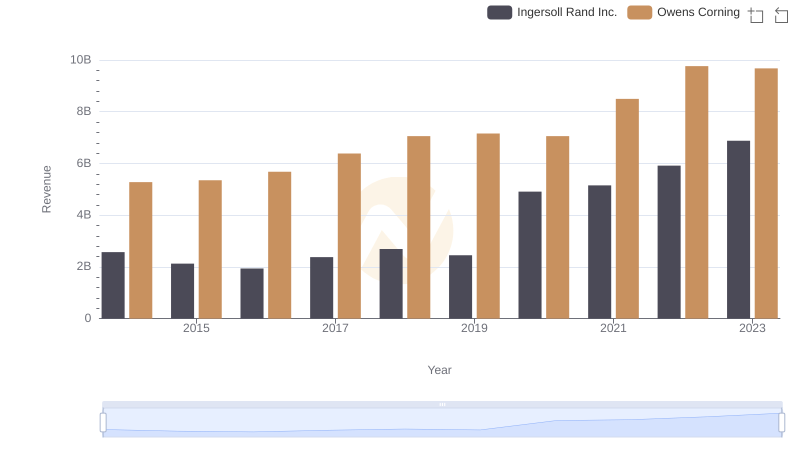
Annual Revenue Comparison: Ingersoll Rand Inc. vs Owens Corning
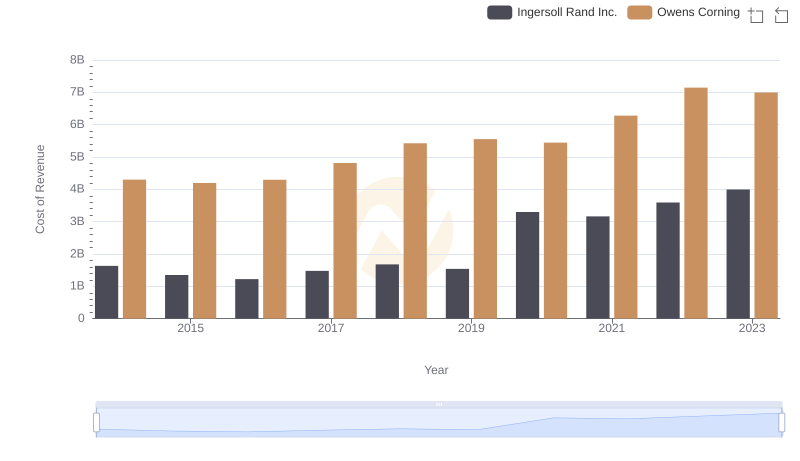
Cost of Revenue: Key Insights for Ingersoll Rand Inc. and Owens Corning
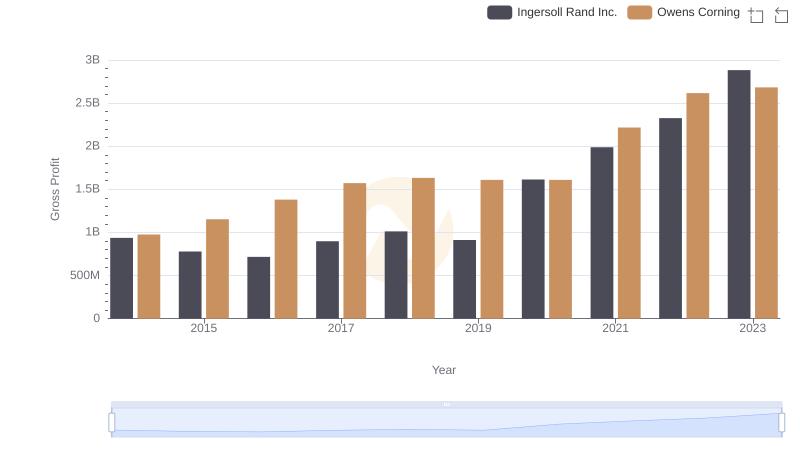
Who Generates Higher Gross Profit? Ingersoll Rand Inc. or Owens Corning
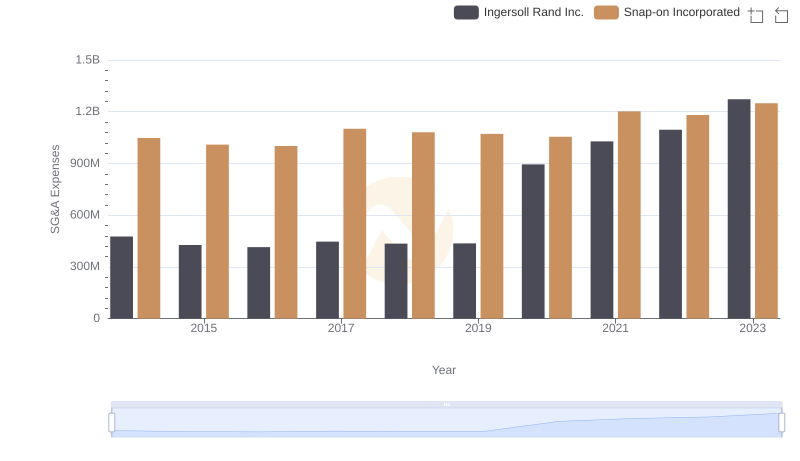
Cost Management Insights: SG&A Expenses for Ingersoll Rand Inc. and Snap-on Incorporated
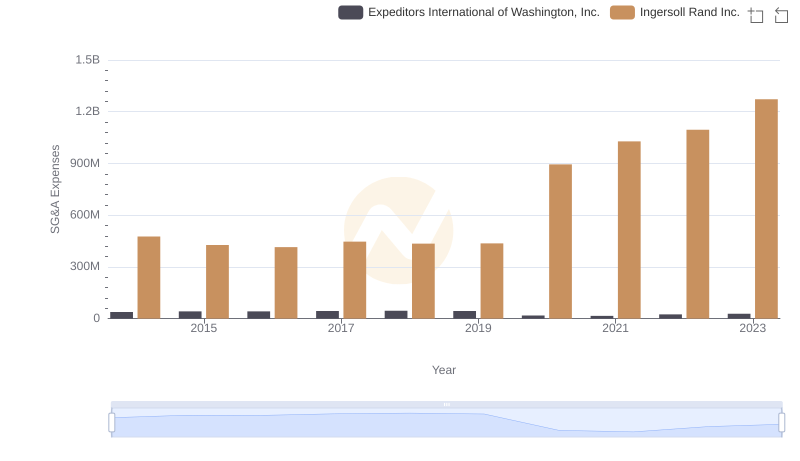
Ingersoll Rand Inc. and Expeditors International of Washington, Inc.: SG&A Spending Patterns Compared
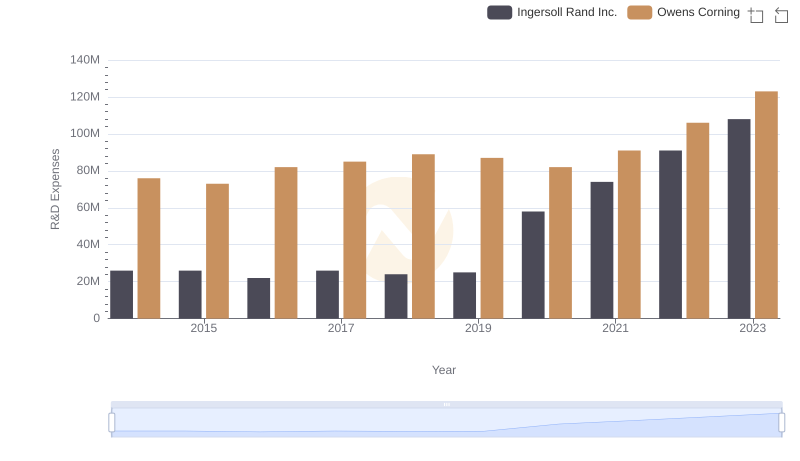
R&D Insights: How Ingersoll Rand Inc. and Owens Corning Allocate Funds
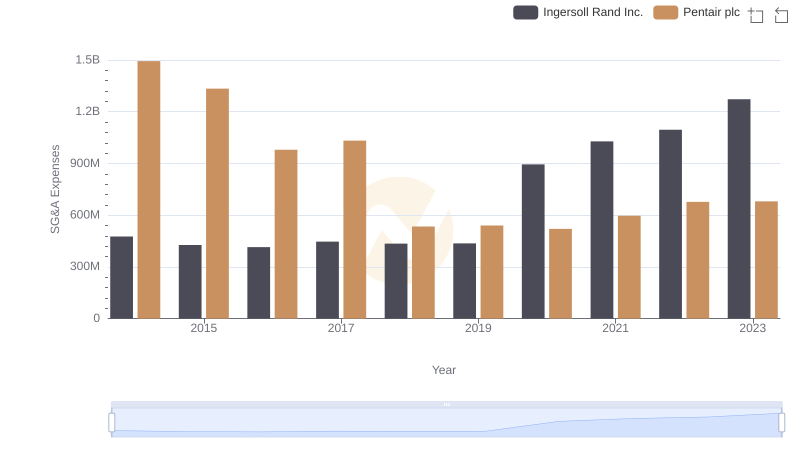
Comparing SG&A Expenses: Ingersoll Rand Inc. vs Pentair plc Trends and Insights
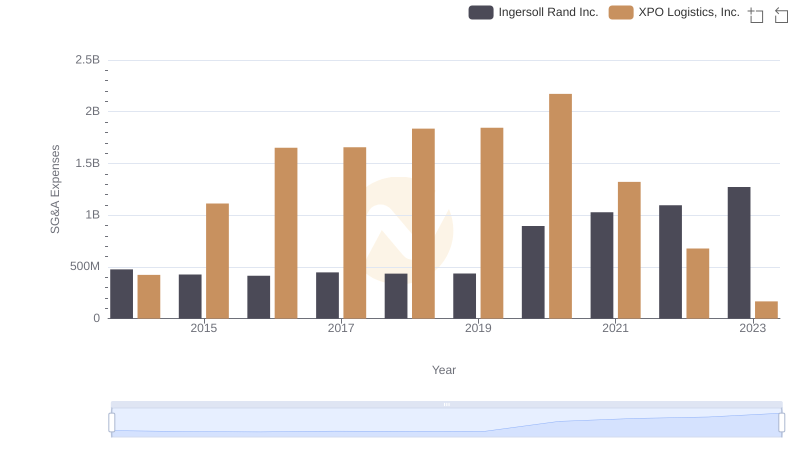
Ingersoll Rand Inc. or XPO Logistics, Inc.: Who Manages SG&A Costs Better?
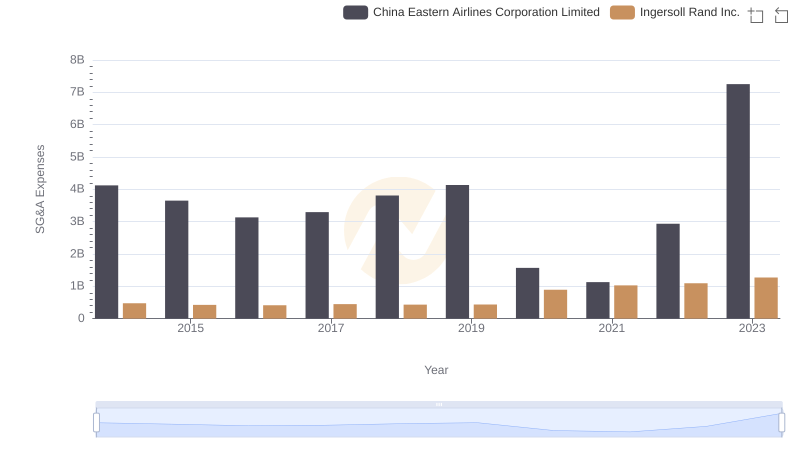
Selling, General, and Administrative Costs: Ingersoll Rand Inc. vs China Eastern Airlines Corporation Limited
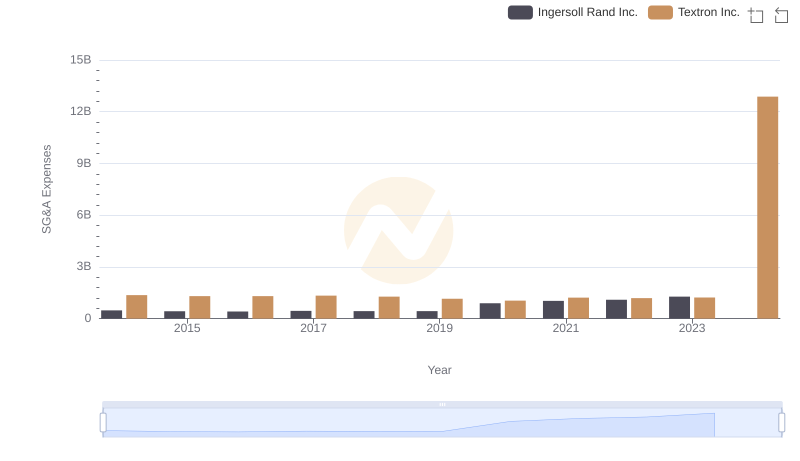
Ingersoll Rand Inc. or Textron Inc.: Who Manages SG&A Costs Better?
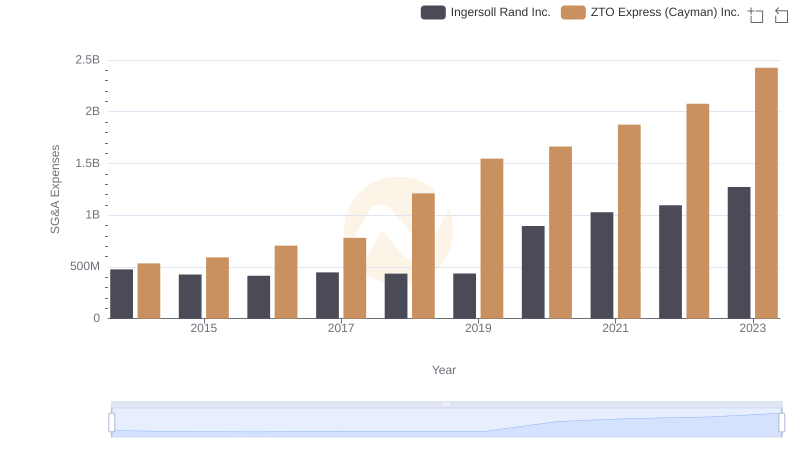
Comparing SG&A Expenses: Ingersoll Rand Inc. vs ZTO Express (Cayman) Inc. Trends and Insights