| __timestamp | Expeditors International of Washington, Inc. | Ingersoll Rand Inc. |
|---|---|---|
| Wednesday, January 1, 2014 | 38125000 | 476000000 |
| Thursday, January 1, 2015 | 41990000 | 427000000 |
| Friday, January 1, 2016 | 41763000 | 414339000 |
| Sunday, January 1, 2017 | 44290000 | 446600000 |
| Monday, January 1, 2018 | 45346000 | 434600000 |
| Tuesday, January 1, 2019 | 44002000 | 436400000 |
| Wednesday, January 1, 2020 | 18436000 | 894800000 |
| Friday, January 1, 2021 | 16026000 | 1028000000 |
| Saturday, January 1, 2022 | 24293000 | 1095800000 |
| Sunday, January 1, 2023 | 27913000 | 1272700000 |
| Monday, January 1, 2024 | 33331000 | 0 |
Infusing magic into the data realm
In the world of corporate finance, understanding a company's spending patterns can reveal much about its strategic priorities. This analysis compares the Selling, General, and Administrative (SG&A) expenses of Ingersoll Rand Inc. and Expeditors International of Washington, Inc. from 2014 to 2023.
Ingersoll Rand Inc. has shown a remarkable upward trend in SG&A expenses, increasing by approximately 167% over the decade. This growth reflects the company's strategic investments in operational efficiency and market expansion.
Conversely, Expeditors International's SG&A expenses have fluctuated, peaking in 2018 and then declining by about 38% by 2023. This pattern suggests a focus on cost optimization and perhaps a shift in business strategy.
These contrasting trends offer a fascinating glimpse into how two industry leaders navigate their financial landscapes.
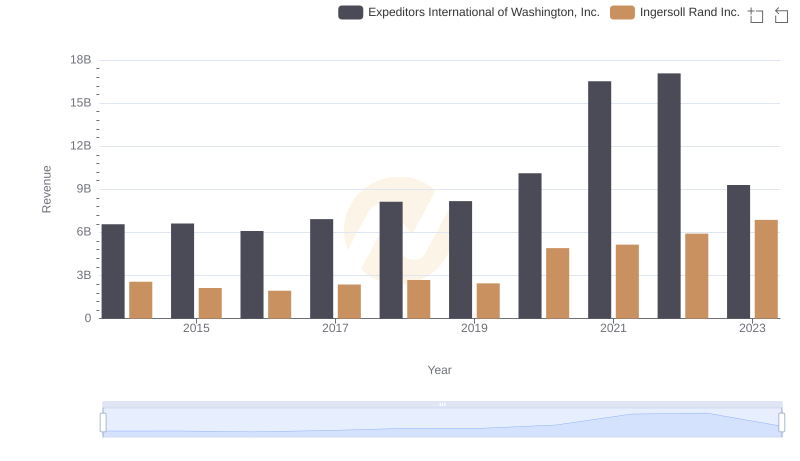
Revenue Insights: Ingersoll Rand Inc. and Expeditors International of Washington, Inc. Performance Compared
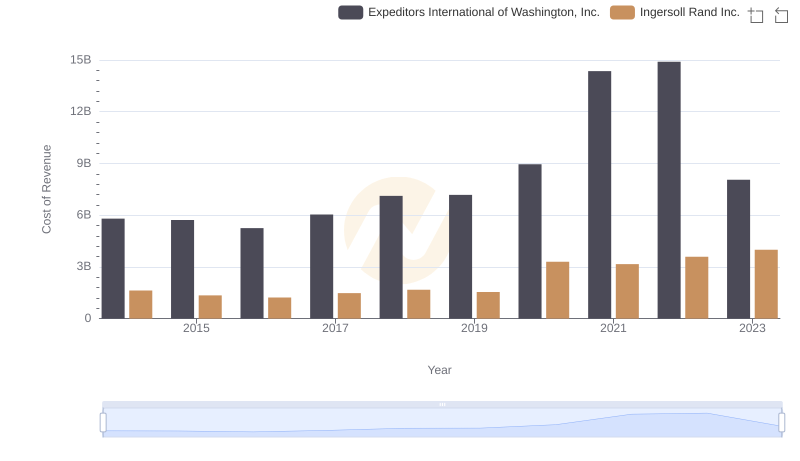
Ingersoll Rand Inc. vs Expeditors International of Washington, Inc.: Efficiency in Cost of Revenue Explored
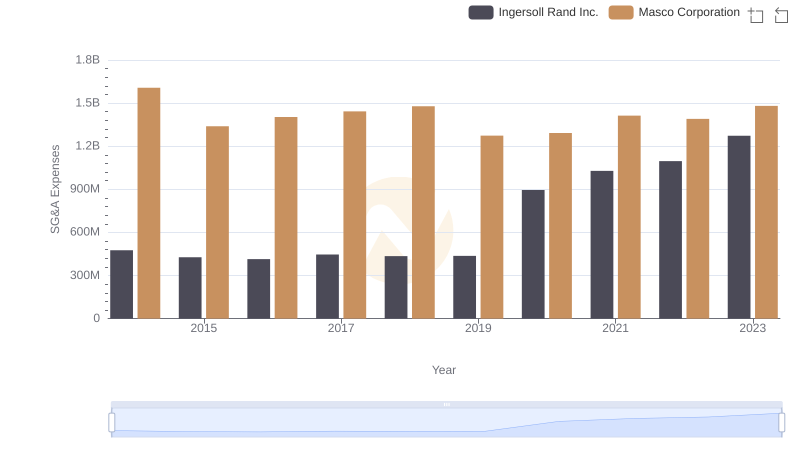
Ingersoll Rand Inc. or Masco Corporation: Who Manages SG&A Costs Better?
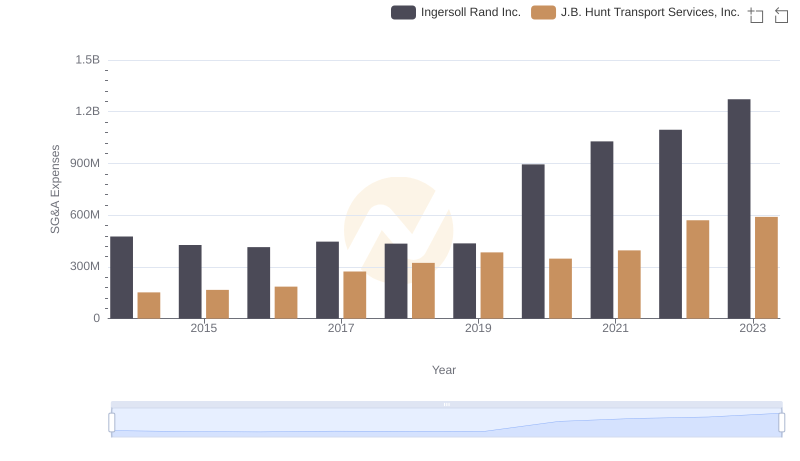
Ingersoll Rand Inc. or J.B. Hunt Transport Services, Inc.: Who Manages SG&A Costs Better?
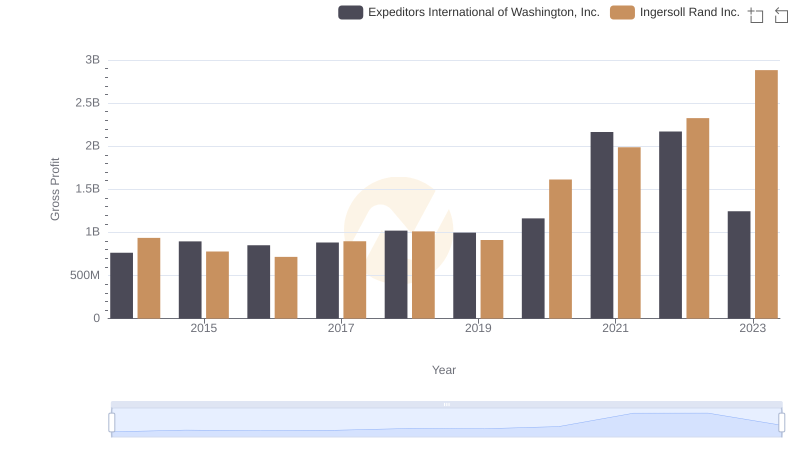
Who Generates Higher Gross Profit? Ingersoll Rand Inc. or Expeditors International of Washington, Inc.
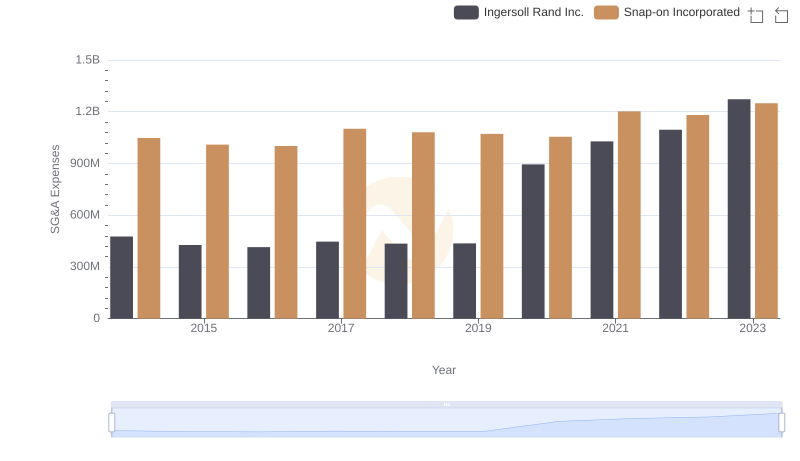
Cost Management Insights: SG&A Expenses for Ingersoll Rand Inc. and Snap-on Incorporated
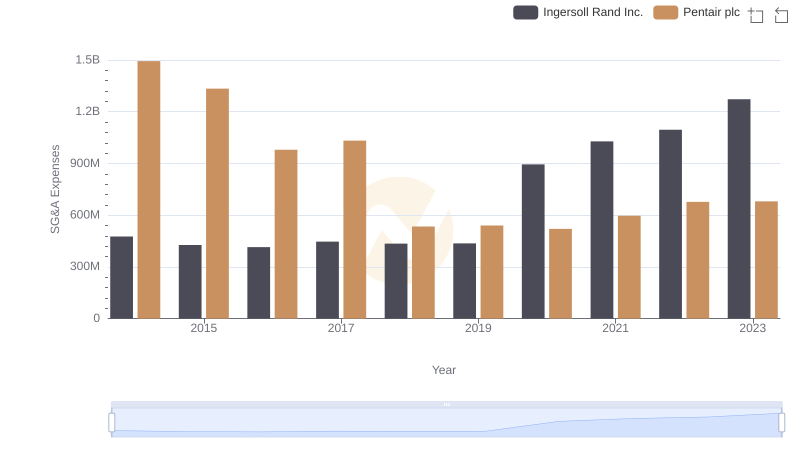
Comparing SG&A Expenses: Ingersoll Rand Inc. vs Pentair plc Trends and Insights
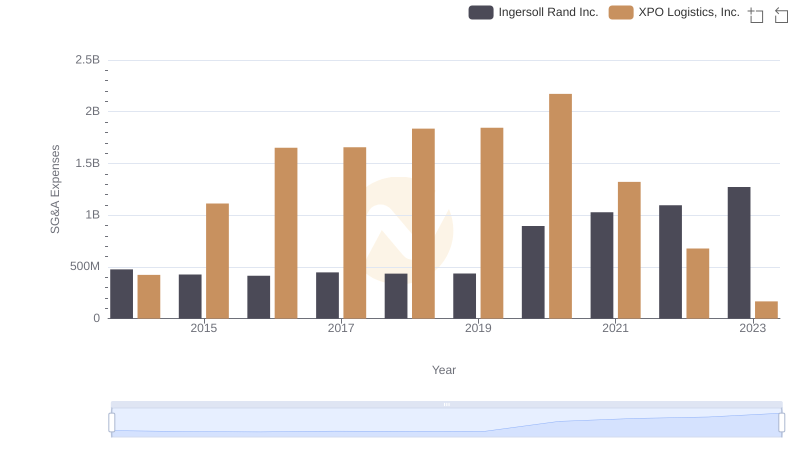
Ingersoll Rand Inc. or XPO Logistics, Inc.: Who Manages SG&A Costs Better?