| __timestamp | Clean Harbors, Inc. | Watsco, Inc. |
|---|---|---|
| Wednesday, January 1, 2014 | 3401636000 | 3944540000 |
| Thursday, January 1, 2015 | 3275137000 | 4113239000 |
| Friday, January 1, 2016 | 2755226000 | 4220702000 |
| Sunday, January 1, 2017 | 2944978000 | 4341955000 |
| Monday, January 1, 2018 | 3300303000 | 4546653000 |
| Tuesday, January 1, 2019 | 3412190000 | 4770362000 |
| Wednesday, January 1, 2020 | 3144097000 | 5054928000 |
| Friday, January 1, 2021 | 3805566000 | 6280192000 |
| Saturday, January 1, 2022 | 5166605000 | 7274344000 |
| Sunday, January 1, 2023 | 5409152000 | 7283767000 |
| Monday, January 1, 2024 | 5889952000 | 7618317000 |
Unleashing the power of data
In the ever-evolving landscape of American industry, Watsco, Inc. and Clean Harbors, Inc. have emerged as significant players over the past decade. From 2014 to 2023, these companies have demonstrated contrasting revenue trajectories, reflecting their unique market positions and strategies.
Watsco, Inc. has shown a robust growth pattern, with its revenue increasing by approximately 85% over the decade. This steady climb underscores its strategic expansion and market penetration, particularly in the HVAC distribution sector.
Clean Harbors, Inc., while experiencing fluctuations, has managed a commendable 59% revenue growth. Its resilience is evident in its ability to rebound from a dip in 2016, showcasing its adaptability in the environmental services industry.
This comparative analysis highlights the dynamic nature of revenue growth in diverse sectors, offering valuable insights for investors and industry enthusiasts alike.
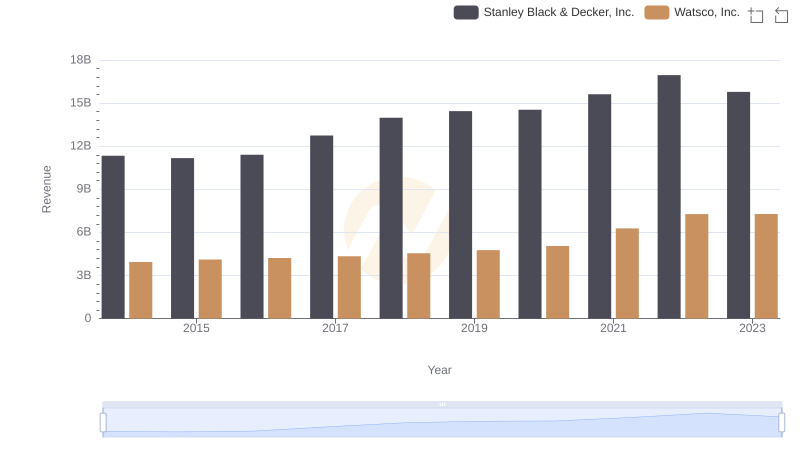
Who Generates More Revenue? Watsco, Inc. or Stanley Black & Decker, Inc.
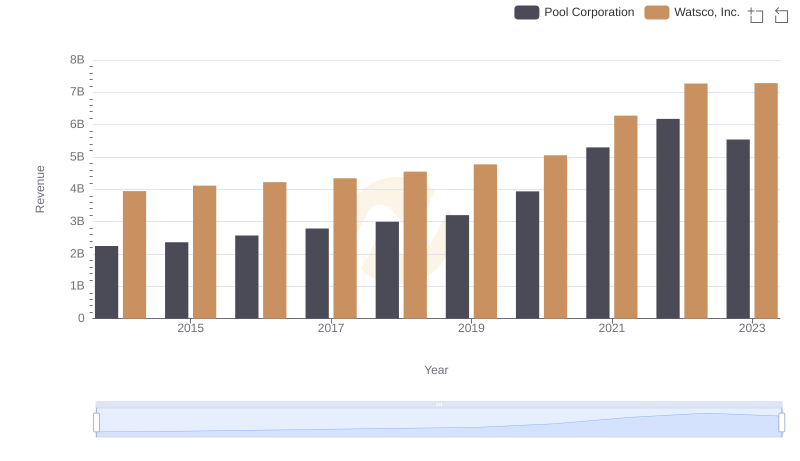
Watsco, Inc. vs Pool Corporation: Annual Revenue Growth Compared
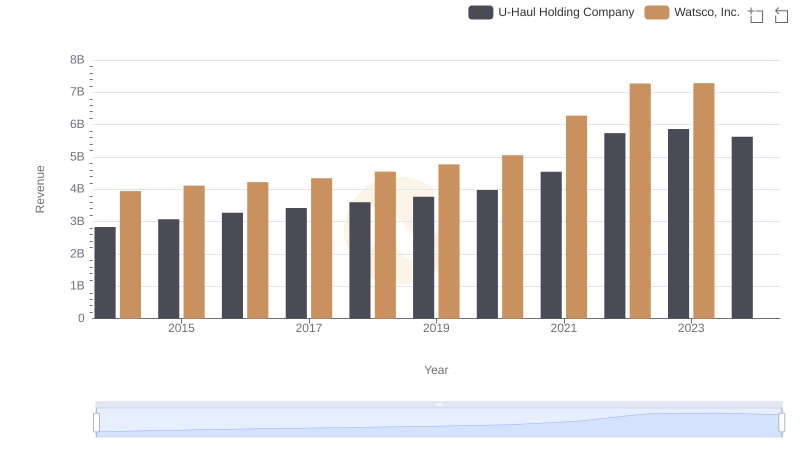
Revenue Showdown: Watsco, Inc. vs U-Haul Holding Company
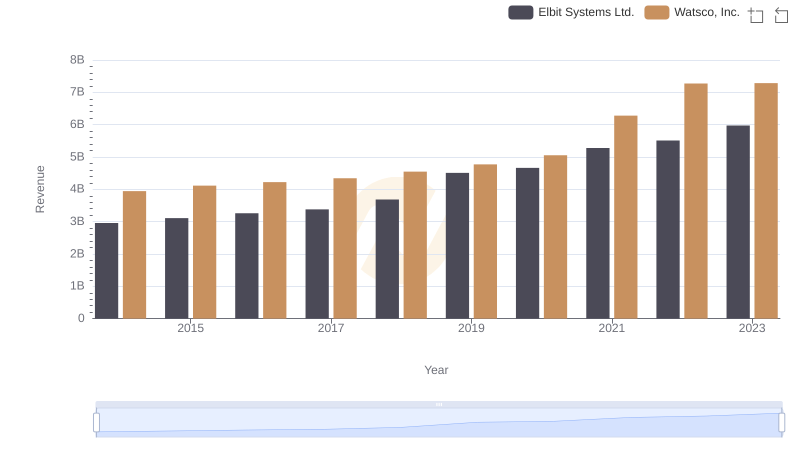
Breaking Down Revenue Trends: Watsco, Inc. vs Elbit Systems Ltd.
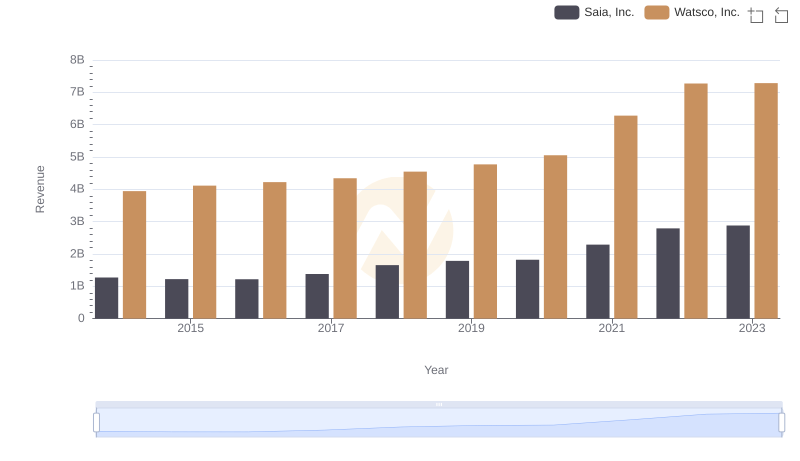
Annual Revenue Comparison: Watsco, Inc. vs Saia, Inc.
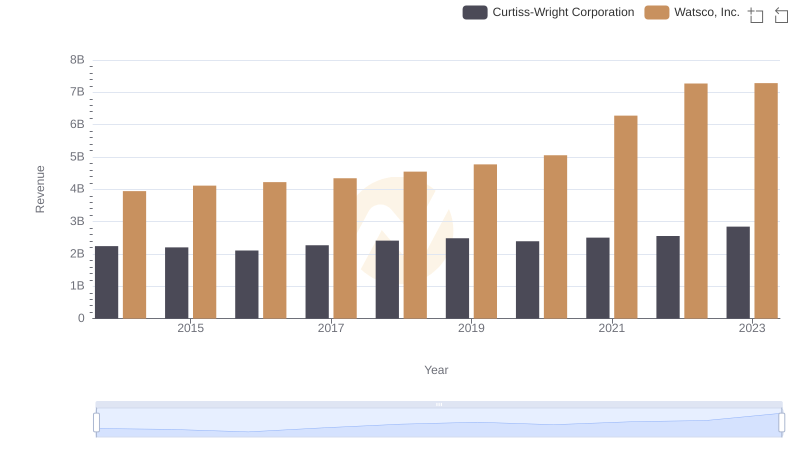
Breaking Down Revenue Trends: Watsco, Inc. vs Curtiss-Wright Corporation
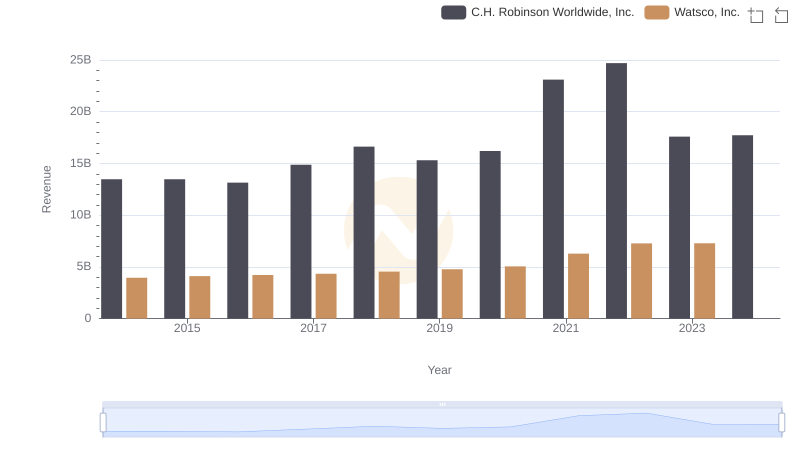
Annual Revenue Comparison: Watsco, Inc. vs C.H. Robinson Worldwide, Inc.
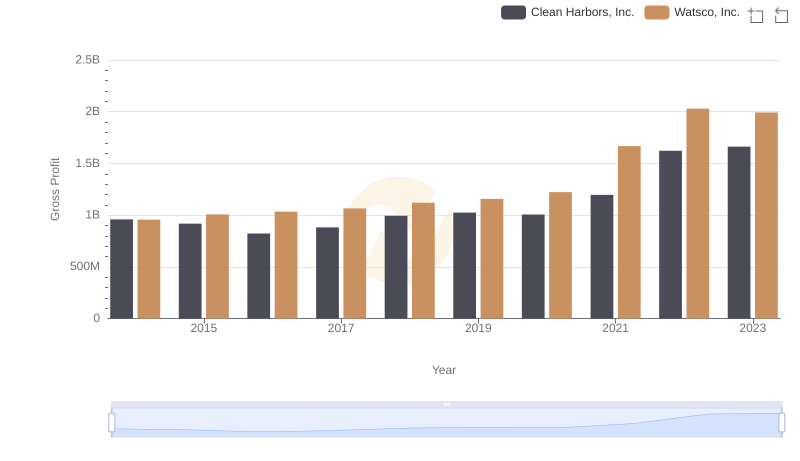
Gross Profit Trends Compared: Watsco, Inc. vs Clean Harbors, Inc.
Operational Costs Compared: SG&A Analysis of Watsco, Inc. and Clean Harbors, Inc.
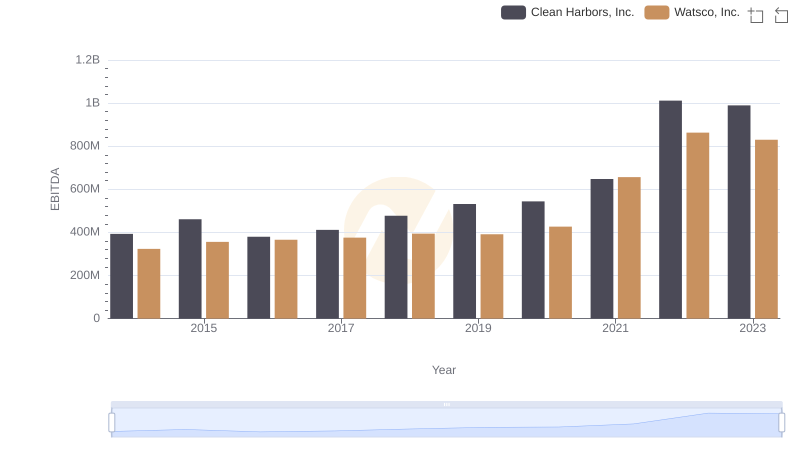
A Side-by-Side Analysis of EBITDA: Watsco, Inc. and Clean Harbors, Inc.