| __timestamp | FLEETCOR Technologies, Inc. | Infosys Limited |
|---|---|---|
| Wednesday, January 1, 2014 | 1026053000 | 3337000000 |
| Thursday, January 1, 2015 | 1371792000 | 3551000000 |
| Friday, January 1, 2016 | 1476132000 | 3762000000 |
| Sunday, January 1, 2017 | 1819925000 | 3938000000 |
| Monday, January 1, 2018 | 1945797000 | 4112000000 |
| Tuesday, January 1, 2019 | 2118179000 | 4228000000 |
| Wednesday, January 1, 2020 | 1792492000 | 4733000000 |
| Friday, January 1, 2021 | 2273917000 | 5315000000 |
| Saturday, January 1, 2022 | 2662422000 | 5503000000 |
| Sunday, January 1, 2023 | 2727580001 | 5466000000 |
| Monday, January 1, 2024 | 3974589000 |
Cracking the code
In the ever-evolving landscape of global business, understanding the financial health of leading companies is crucial. This analysis delves into the gross profit trends of two industry giants: Infosys Limited and FLEETCOR Technologies, Inc., from 2014 to 2023.
Infosys, a titan in the IT services sector, has consistently demonstrated robust growth, with its gross profit increasing by approximately 64% over the decade. In contrast, FLEETCOR, a leader in business payments solutions, has seen its gross profit nearly triple, marking a remarkable 166% growth.
The data reveals that while Infosys maintains a higher gross profit, FLEETCOR's growth rate is significantly faster. This divergence highlights the dynamic nature of these industries and underscores the importance of strategic financial management. As we move forward, these trends offer valuable insights into the competitive strategies of these global leaders.
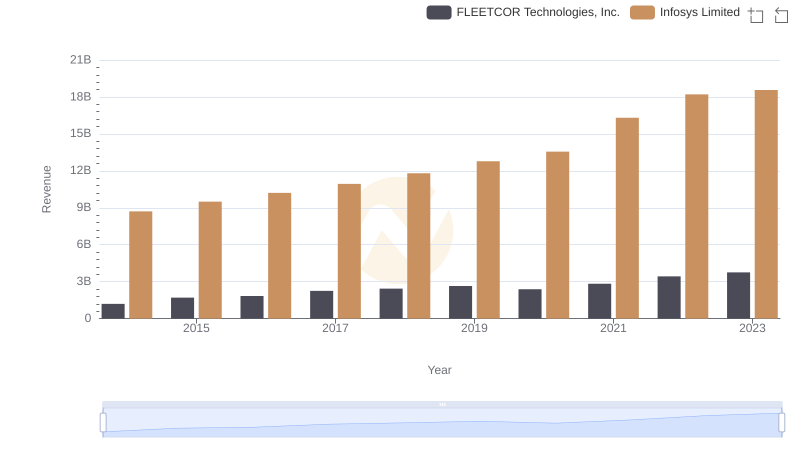
Breaking Down Revenue Trends: Infosys Limited vs FLEETCOR Technologies, Inc.
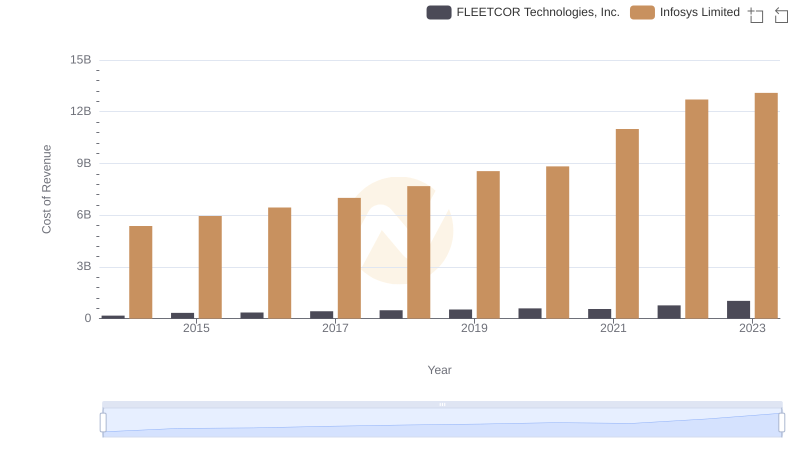
Comparing Cost of Revenue Efficiency: Infosys Limited vs FLEETCOR Technologies, Inc.
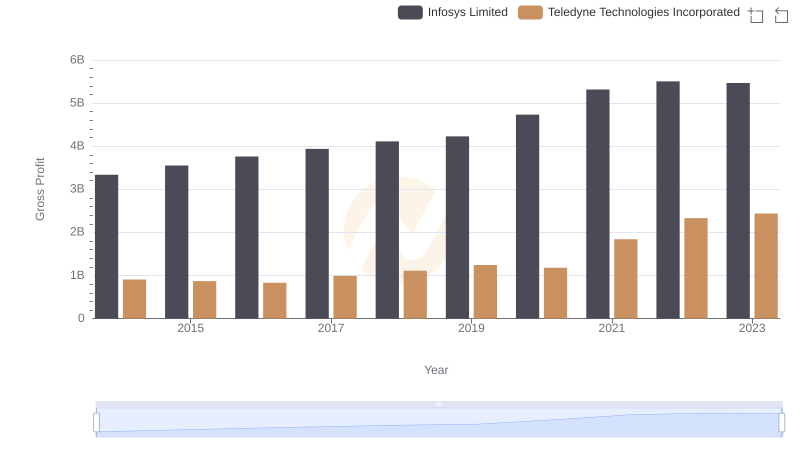
Gross Profit Comparison: Infosys Limited and Teledyne Technologies Incorporated Trends
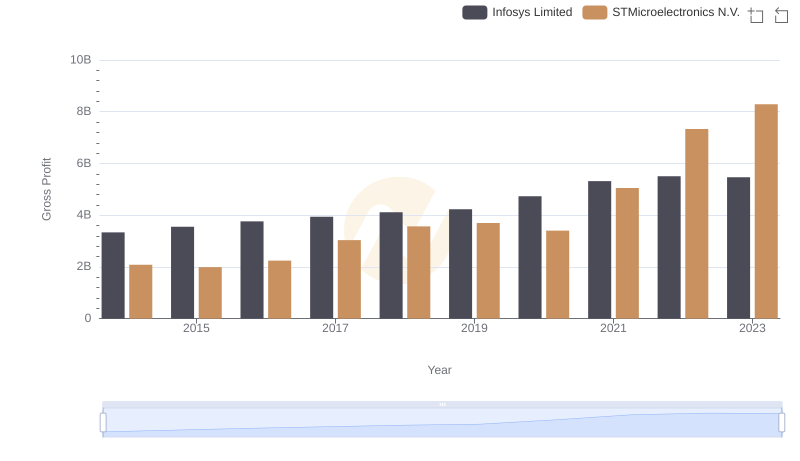
Infosys Limited and STMicroelectronics N.V.: A Detailed Gross Profit Analysis
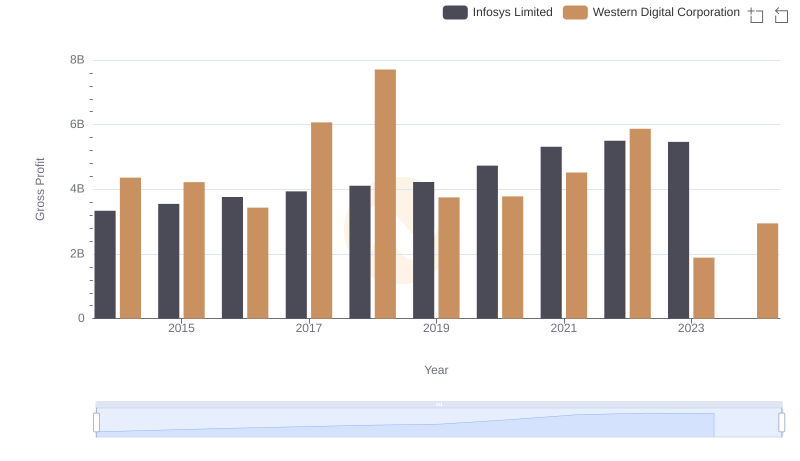
Infosys Limited and Western Digital Corporation: A Detailed Gross Profit Analysis
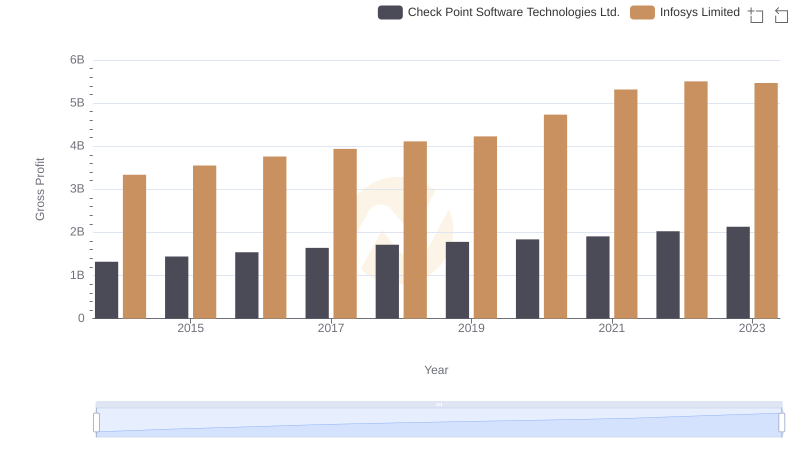
Infosys Limited vs Check Point Software Technologies Ltd.: A Gross Profit Performance Breakdown
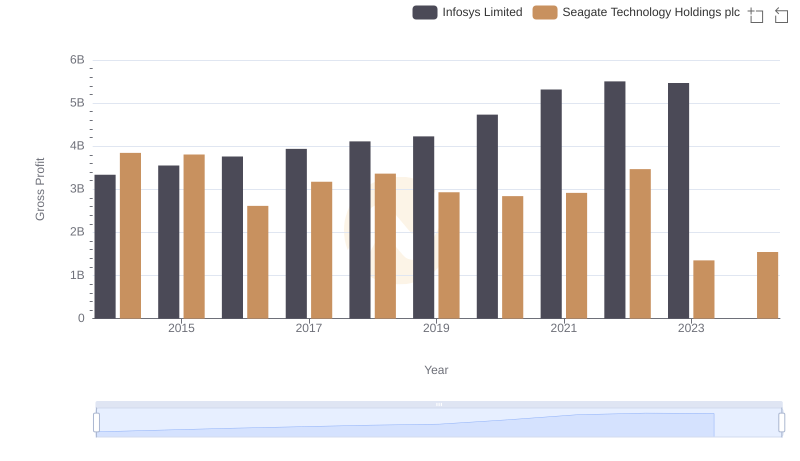
Gross Profit Comparison: Infosys Limited and Seagate Technology Holdings plc Trends
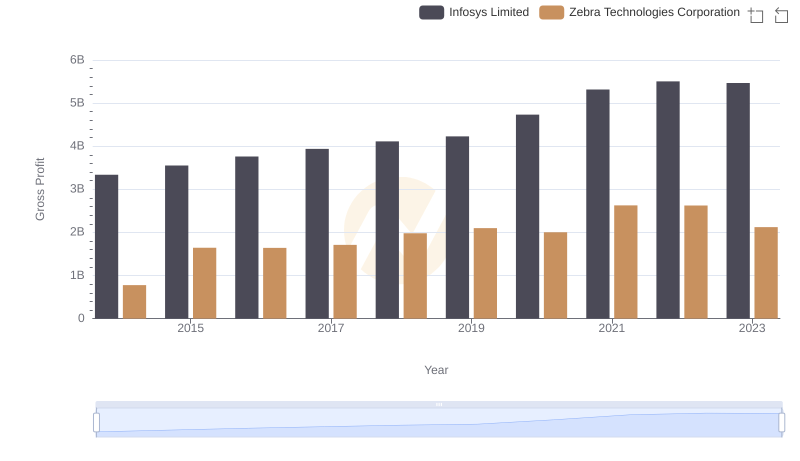
Infosys Limited vs Zebra Technologies Corporation: A Gross Profit Performance Breakdown
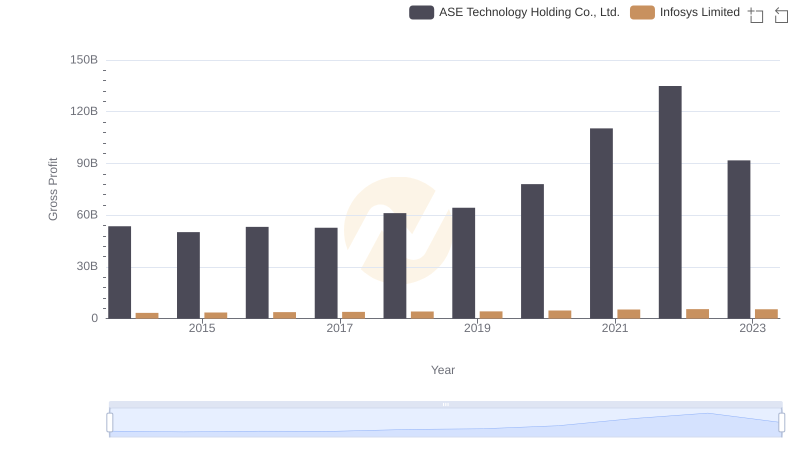
Gross Profit Trends Compared: Infosys Limited vs ASE Technology Holding Co., Ltd.
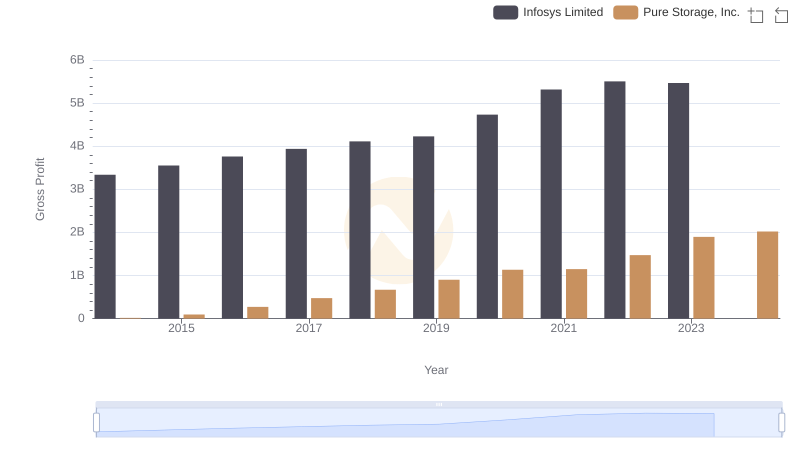
Infosys Limited and Pure Storage, Inc.: A Detailed Gross Profit Analysis
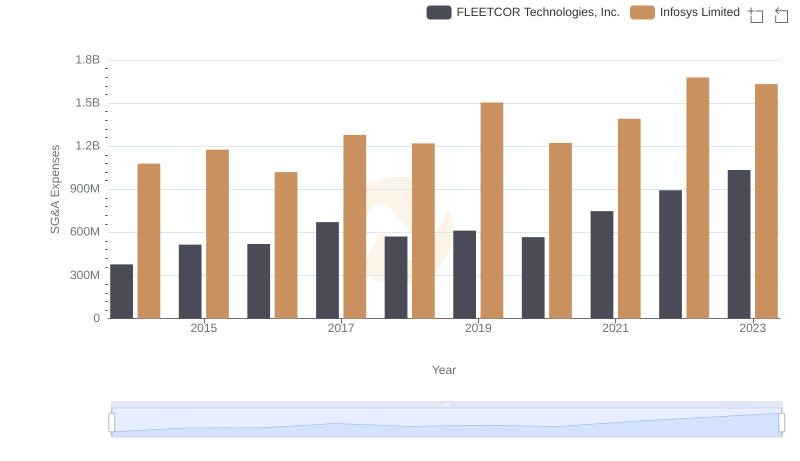
Who Optimizes SG&A Costs Better? Infosys Limited or FLEETCOR Technologies, Inc.
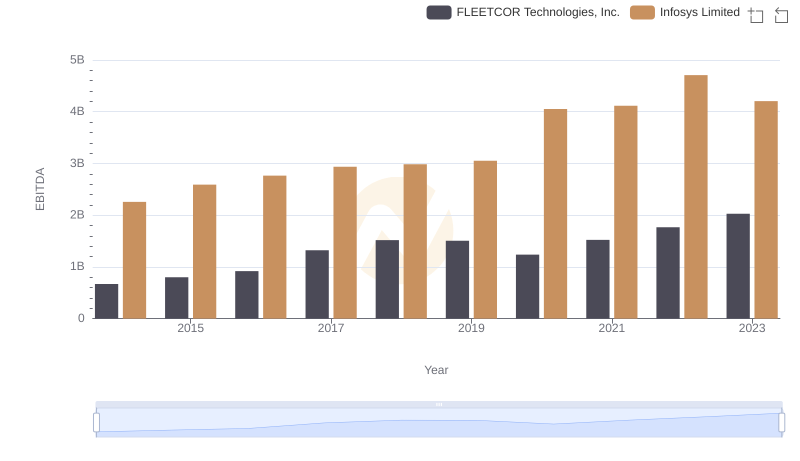
Infosys Limited and FLEETCOR Technologies, Inc.: A Detailed Examination of EBITDA Performance