| __timestamp | CSX Corporation | Graco Inc. |
|---|---|---|
| Wednesday, January 1, 2014 | 3613000000 | 666736000 |
| Thursday, January 1, 2015 | 3584000000 | 684700000 |
| Friday, January 1, 2016 | 3389000000 | 708239000 |
| Sunday, January 1, 2017 | 3773000000 | 793049000 |
| Monday, January 1, 2018 | 4773000000 | 882539000 |
| Tuesday, January 1, 2019 | 4874000000 | 859756000 |
| Wednesday, January 1, 2020 | 4362000000 | 854937000 |
| Friday, January 1, 2021 | 5140000000 | 1033949000 |
| Saturday, January 1, 2022 | 5785000000 | 1057439000 |
| Sunday, January 1, 2023 | 5527000000 | 1161021000 |
| Monday, January 1, 2024 | 1122461000 |
Data in motion
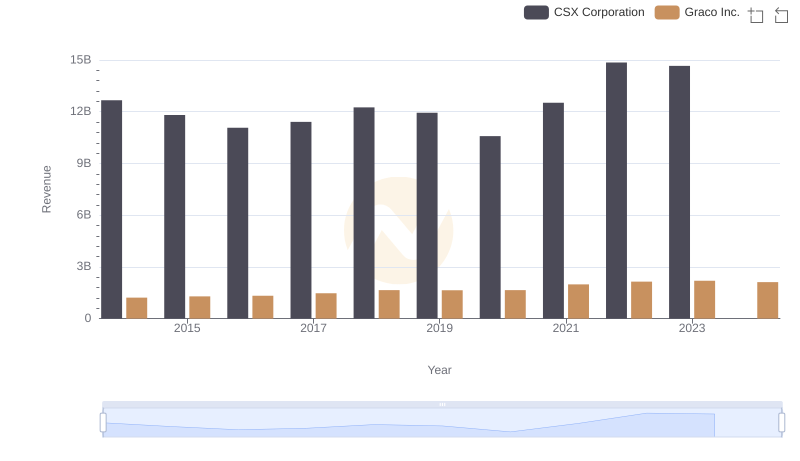
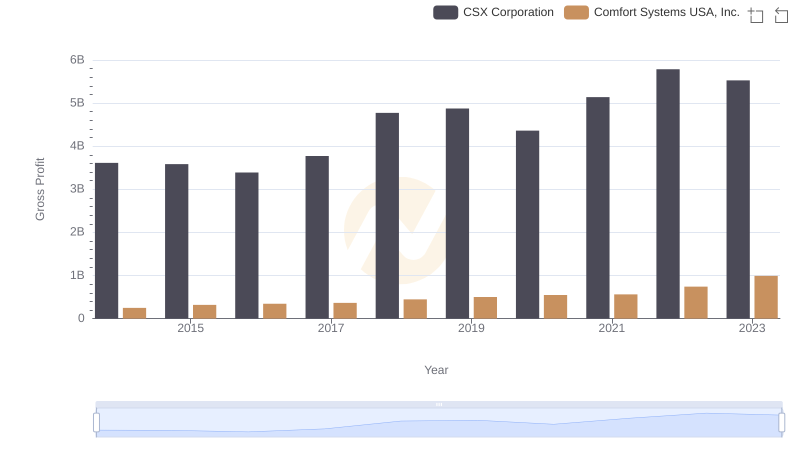
In the ever-evolving landscape of American industry, the financial performance of companies like CSX Corporation and Graco Inc. offers a fascinating glimpse into their strategic prowess. Over the past decade, CSX Corporation, a leader in the transportation sector, has seen its gross profit grow by approximately 53%, peaking in 2022. This growth reflects the company's robust operational efficiencies and strategic investments.
Meanwhile, Graco Inc., a stalwart in the manufacturing industry, has demonstrated a steady upward trajectory, with its gross profit increasing by about 74% from 2014 to 2023. This consistent growth underscores Graco's commitment to innovation and market expansion.
While CSX's gross profit took a slight dip in 2023, Graco continued its upward climb, highlighting the resilience and adaptability of the manufacturing sector. As we look to the future, these trends offer valuable insights into the economic forces shaping these industries.