| __timestamp | Automatic Data Processing, Inc. | Booz Allen Hamilton Holding Corporation |
|---|---|---|
| Wednesday, January 1, 2014 | 4611400000 | 2762580000 |
| Thursday, January 1, 2015 | 4133200000 | 2680921000 |
| Friday, January 1, 2016 | 4450200000 | 2825712000 |
| Sunday, January 1, 2017 | 4712600000 | 3112302000 |
| Monday, January 1, 2018 | 5016700000 | 3304750000 |
| Tuesday, January 1, 2019 | 5526700000 | 3603571000 |
| Wednesday, January 1, 2020 | 6144700000 | 4084661000 |
| Friday, January 1, 2021 | 6365100000 | 4201408000 |
| Saturday, January 1, 2022 | 7036400000 | 4464078000 |
| Sunday, January 1, 2023 | 8058800000 | 4954101000 |
| Monday, January 1, 2024 | 8725900000 | 2459049000 |
Unlocking the unknown
In the ever-evolving landscape of corporate finance, understanding the trajectory of gross profits is crucial for investors and analysts alike. This chart offers a compelling comparison between Automatic Data Processing, Inc. (ADP) and Booz Allen Hamilton Holding Corporation (BAH) over the past decade.
From 2014 to 2023, ADP has demonstrated a robust growth trajectory, with gross profits increasing by approximately 89%, peaking in 2023. This growth reflects ADP's strategic initiatives and market adaptability. In contrast, BAH's gross profit growth has been more modest, with a 79% increase over the same period, highlighting its steady yet less aggressive expansion strategy.
Interestingly, 2024 shows a significant drop in BAH's gross profit, which could be attributed to market fluctuations or strategic shifts. This divergence in trends underscores the dynamic nature of the business environment and the importance of strategic foresight.
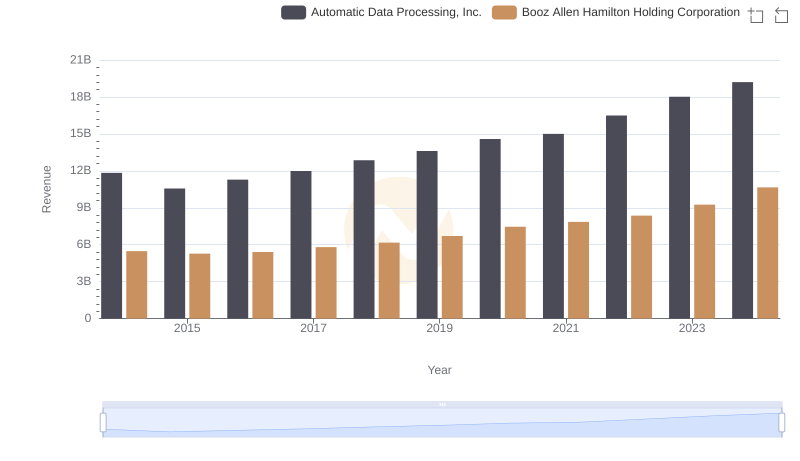
Who Generates More Revenue? Automatic Data Processing, Inc. or Booz Allen Hamilton Holding Corporation
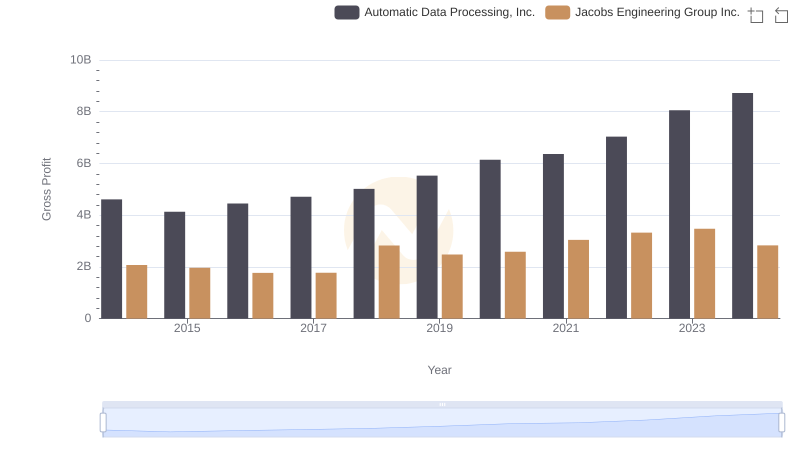
Automatic Data Processing, Inc. vs Jacobs Engineering Group Inc.: A Gross Profit Performance Breakdown
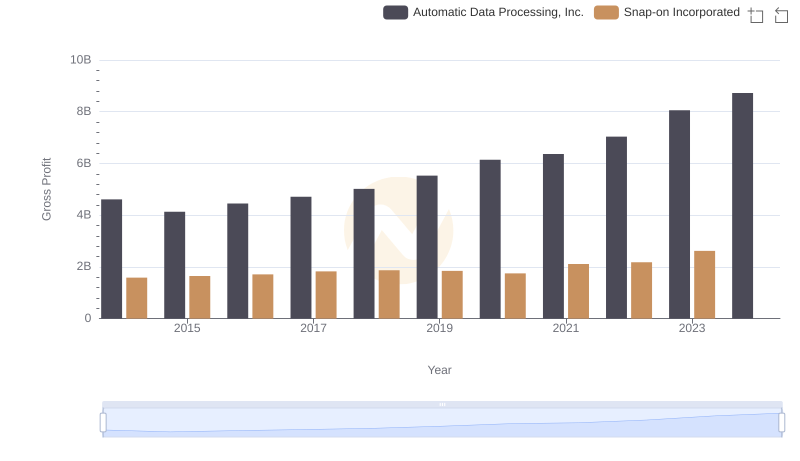
Automatic Data Processing, Inc. and Snap-on Incorporated: A Detailed Gross Profit Analysis
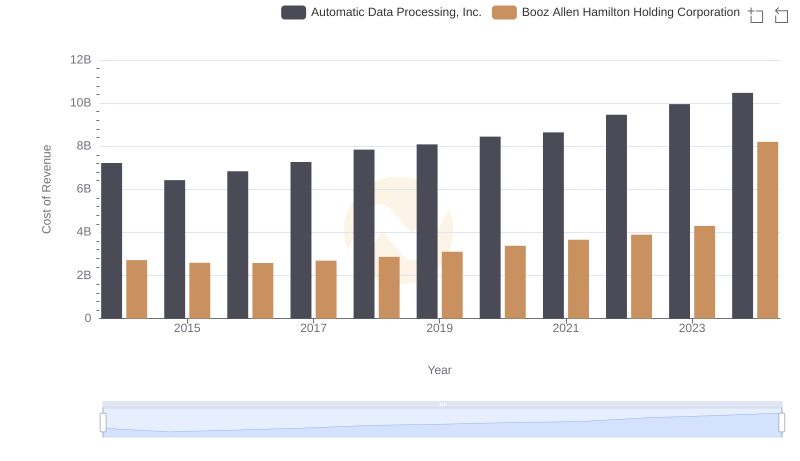
Automatic Data Processing, Inc. vs Booz Allen Hamilton Holding Corporation: Efficiency in Cost of Revenue Explored
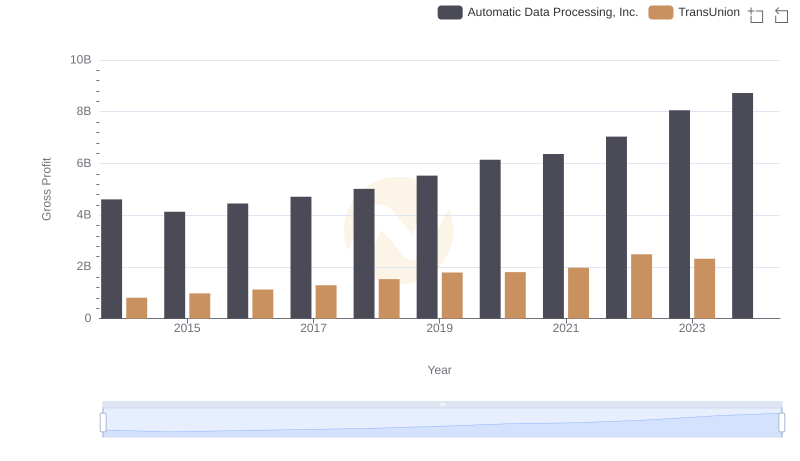
Key Insights on Gross Profit: Automatic Data Processing, Inc. vs TransUnion
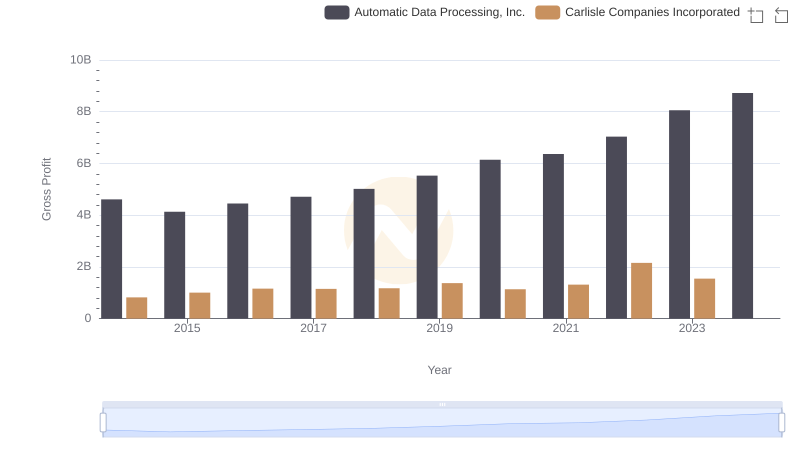
Who Generates Higher Gross Profit? Automatic Data Processing, Inc. or Carlisle Companies Incorporated

Automatic Data Processing, Inc. and J.B. Hunt Transport Services, Inc.: A Detailed Gross Profit Analysis
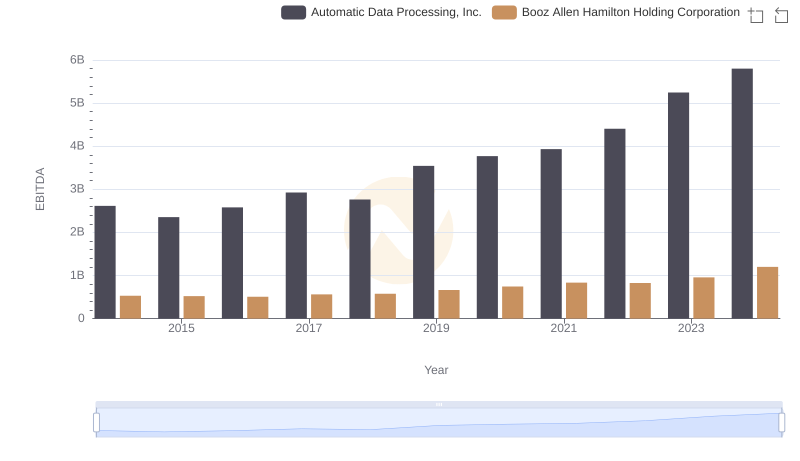
Automatic Data Processing, Inc. and Booz Allen Hamilton Holding Corporation: A Detailed Examination of EBITDA Performance