| __timestamp | AMETEK, Inc. | TFI International Inc. |
|---|---|---|
| Wednesday, January 1, 2014 | 1424947000 | 417323364 |
| Thursday, January 1, 2015 | 1425015000 | 352552803 |
| Friday, January 1, 2016 | 1264867000 | 358230042 |
| Sunday, January 1, 2017 | 1448739000 | 405214314 |
| Monday, January 1, 2018 | 1659562000 | 510006388 |
| Tuesday, January 1, 2019 | 1787660000 | 502631921 |
| Wednesday, January 1, 2020 | 1543514000 | 541885000 |
| Friday, January 1, 2021 | 1912614000 | 1037863000 |
| Saturday, January 1, 2022 | 2145269000 | 1426851000 |
| Sunday, January 1, 2023 | 2384465001 | 1265392000 |
| Monday, January 1, 2024 | 6941180000 |
Igniting the spark of knowledge
In the ever-evolving landscape of industrial and transportation sectors, AMETEK, Inc. and TFI International Inc. have showcased intriguing gross profit trends over the past decade. From 2014 to 2023, AMETEK, Inc. has consistently outperformed TFI International Inc., with a notable 67% increase in gross profit, peaking at approximately $2.38 billion in 2023. Meanwhile, TFI International Inc. experienced a remarkable growth spurt, particularly between 2020 and 2022, where its gross profit surged by 163%, reaching around $1.43 billion in 2022. This growth trajectory highlights TFI's strategic expansions and market adaptations. As we delve into these financial narratives, it becomes evident that both companies have navigated their respective industries with resilience and strategic foresight, adapting to market demands and economic shifts.
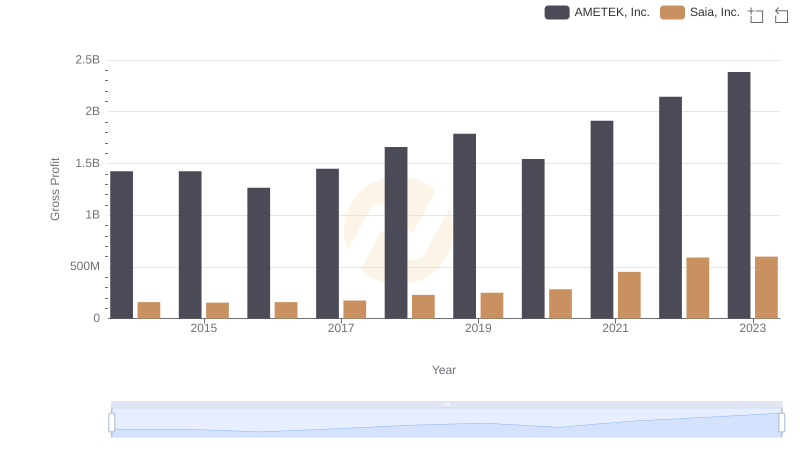
Gross Profit Trends Compared: AMETEK, Inc. vs Saia, Inc.
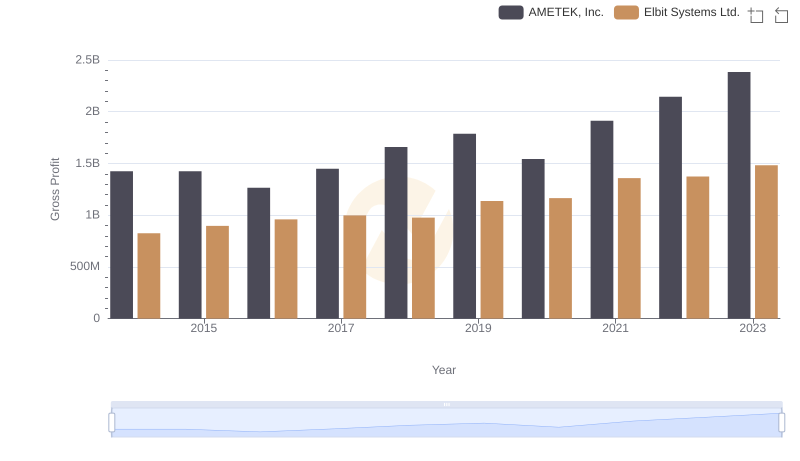
Key Insights on Gross Profit: AMETEK, Inc. vs Elbit Systems Ltd.
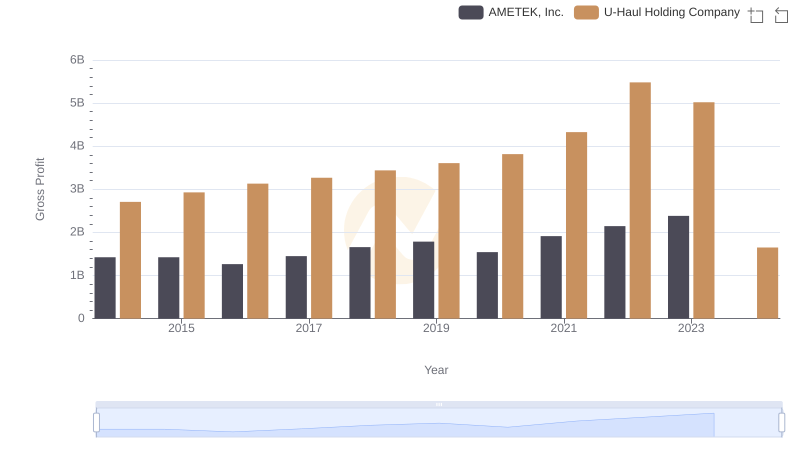
AMETEK, Inc. vs U-Haul Holding Company: A Gross Profit Performance Breakdown
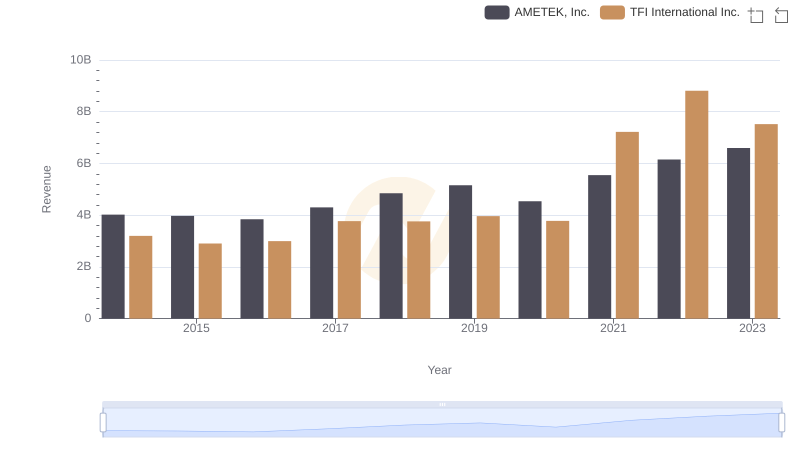
AMETEK, Inc. vs TFI International Inc.: Examining Key Revenue Metrics
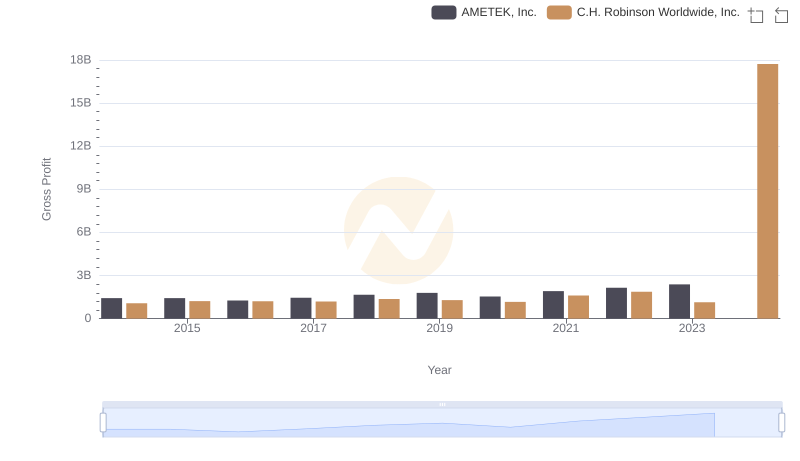
Gross Profit Analysis: Comparing AMETEK, Inc. and C.H. Robinson Worldwide, Inc.
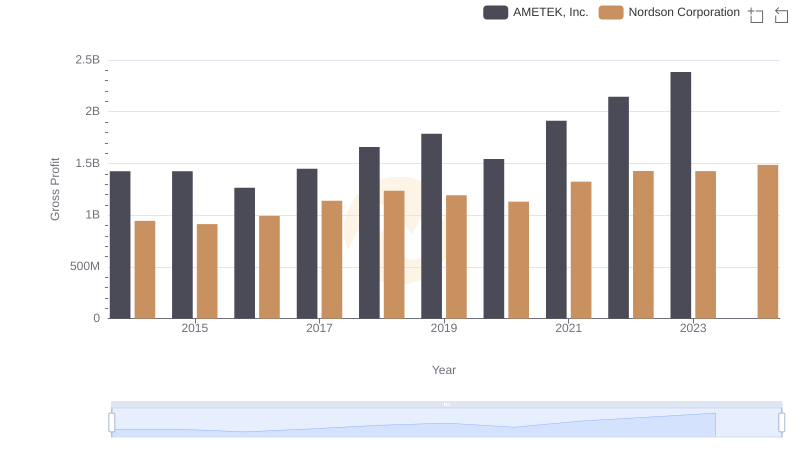
AMETEK, Inc. vs Nordson Corporation: A Gross Profit Performance Breakdown
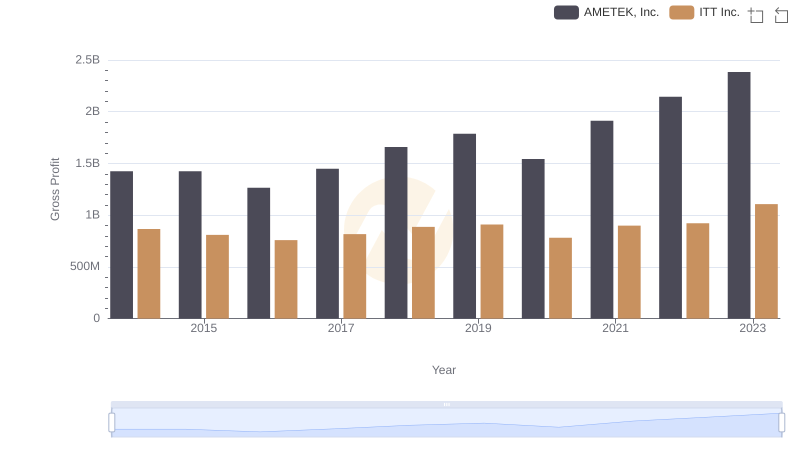
AMETEK, Inc. vs ITT Inc.: A Gross Profit Performance Breakdown
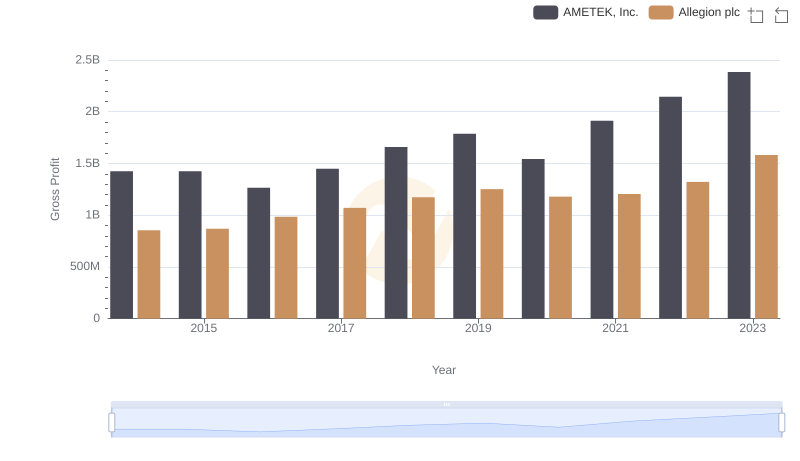
AMETEK, Inc. vs Allegion plc: A Gross Profit Performance Breakdown