| __timestamp | 3M Company | PACCAR Inc |
|---|---|---|
| Wednesday, January 1, 2014 | 15374000000 | 2793200000 |
| Thursday, January 1, 2015 | 14891000000 | 3121300000 |
| Friday, January 1, 2016 | 15069000000 | 2753200000 |
| Sunday, January 1, 2017 | 15656000000 | 2985600000 |
| Monday, January 1, 2018 | 16083000000 | 3655800000 |
| Tuesday, January 1, 2019 | 15000000000 | 4015400000 |
| Wednesday, January 1, 2020 | 15579000000 | 2452000000 |
| Friday, January 1, 2021 | 16560000000 | 3291900000 |
| Saturday, January 1, 2022 | 14997000000 | 4751600000 |
| Sunday, January 1, 2023 | 14204000000 | 7141900000 |
| Monday, January 1, 2024 | 10128000000 | 5494700000 |
Unleashing the power of data
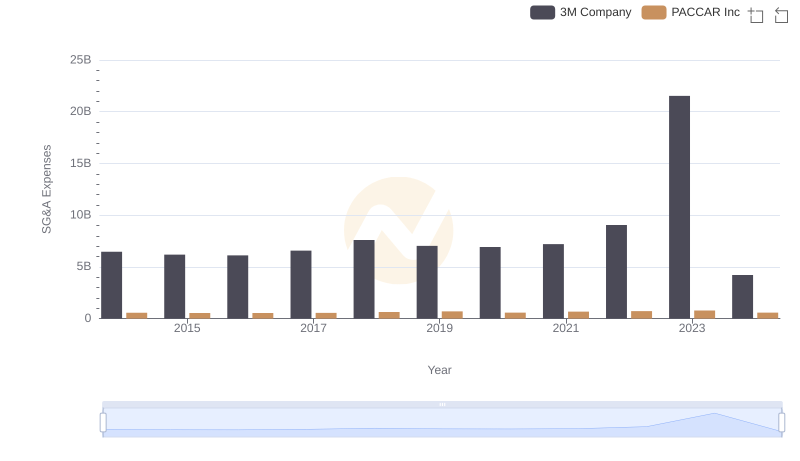
In the ever-evolving landscape of American industry, 3M Company and PACCAR Inc stand as titans in their respective fields. From 2014 to 2024, these companies have showcased intriguing trends in their gross profit margins. 3M, a stalwart in manufacturing, saw its gross profit peak in 2021, only to decline by approximately 39% by 2024. Meanwhile, PACCAR, a leader in the automotive sector, experienced a remarkable surge, with its gross profit more than doubling from 2014 to 2023. This divergence highlights the dynamic nature of industrial growth and adaptation. While 3M faced challenges, PACCAR capitalized on market opportunities, reflecting broader economic shifts. As we delve into these trends, the data offers a compelling narrative of resilience and transformation in the face of global economic pressures.