| __timestamp | 3M Company | Paychex, Inc. |
|---|---|---|
| Wednesday, January 1, 2014 | 15374000000 | 1786400000 |
| Thursday, January 1, 2015 | 14891000000 | 1931600000 |
| Friday, January 1, 2016 | 15069000000 | 2094800000 |
| Sunday, January 1, 2017 | 15656000000 | 2231700000 |
| Monday, January 1, 2018 | 16083000000 | 2363100000 |
| Tuesday, January 1, 2019 | 15000000000 | 2594700000 |
| Wednesday, January 1, 2020 | 15579000000 | 2759700000 |
| Friday, January 1, 2021 | 16560000000 | 2785600000 |
| Saturday, January 1, 2022 | 14997000000 | 3255400000 |
| Sunday, January 1, 2023 | 14204000000 | 3554100000 |
| Monday, January 1, 2024 | 10128000000 | 3799000000 |
Data in motion
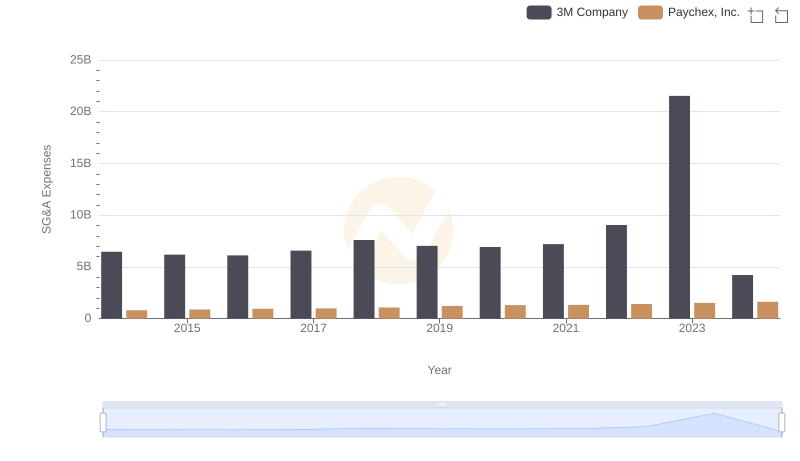
In the ever-evolving landscape of corporate America, the financial performance of industry leaders like 3M Company and Paychex, Inc. offers a fascinating glimpse into their strategic prowess. Over the past decade, 3M's gross profit has seen a modest decline, dropping approximately 7% from its peak in 2017. Meanwhile, Paychex, Inc. has experienced a robust growth trajectory, with its gross profit surging by nearly 113% since 2014.
From 2014 to 2023, 3M's gross profit fluctuated, peaking in 2021 before a notable dip in 2024. In contrast, Paychex, Inc. consistently expanded its financial footprint, reflecting its adaptability and market resilience. By 2024, Paychex's gross profit had nearly doubled, showcasing its strategic growth in the payroll and human resources sector.
This comparative analysis underscores the dynamic nature of business performance and the importance of strategic adaptation in maintaining market leadership.